Verified privacy-enhanced embed
Rick's Cafe, Negril west end
Loading contacts YouTube. The fallback link remains available below.
Jamaica · west-facing
Thinking about Negril? Here is the current seaweed risk for this stretch of coast, what the season usually brings, and where to check with your own eyes. We do not score individual resorts, and no satellite can see this morning's sand; the cams below get you closest.
Compare this coast with another destination
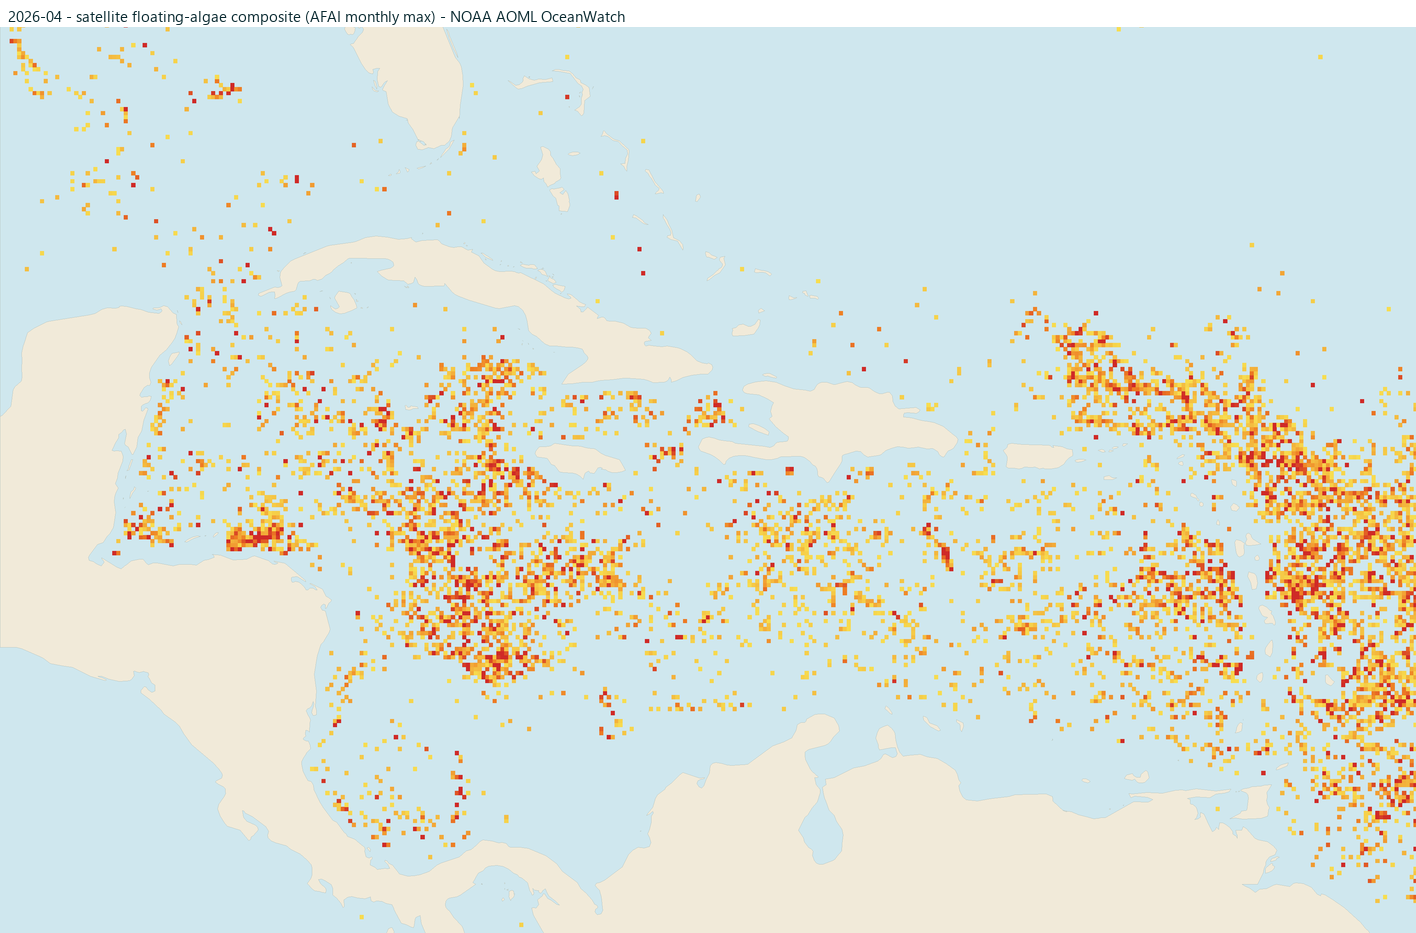
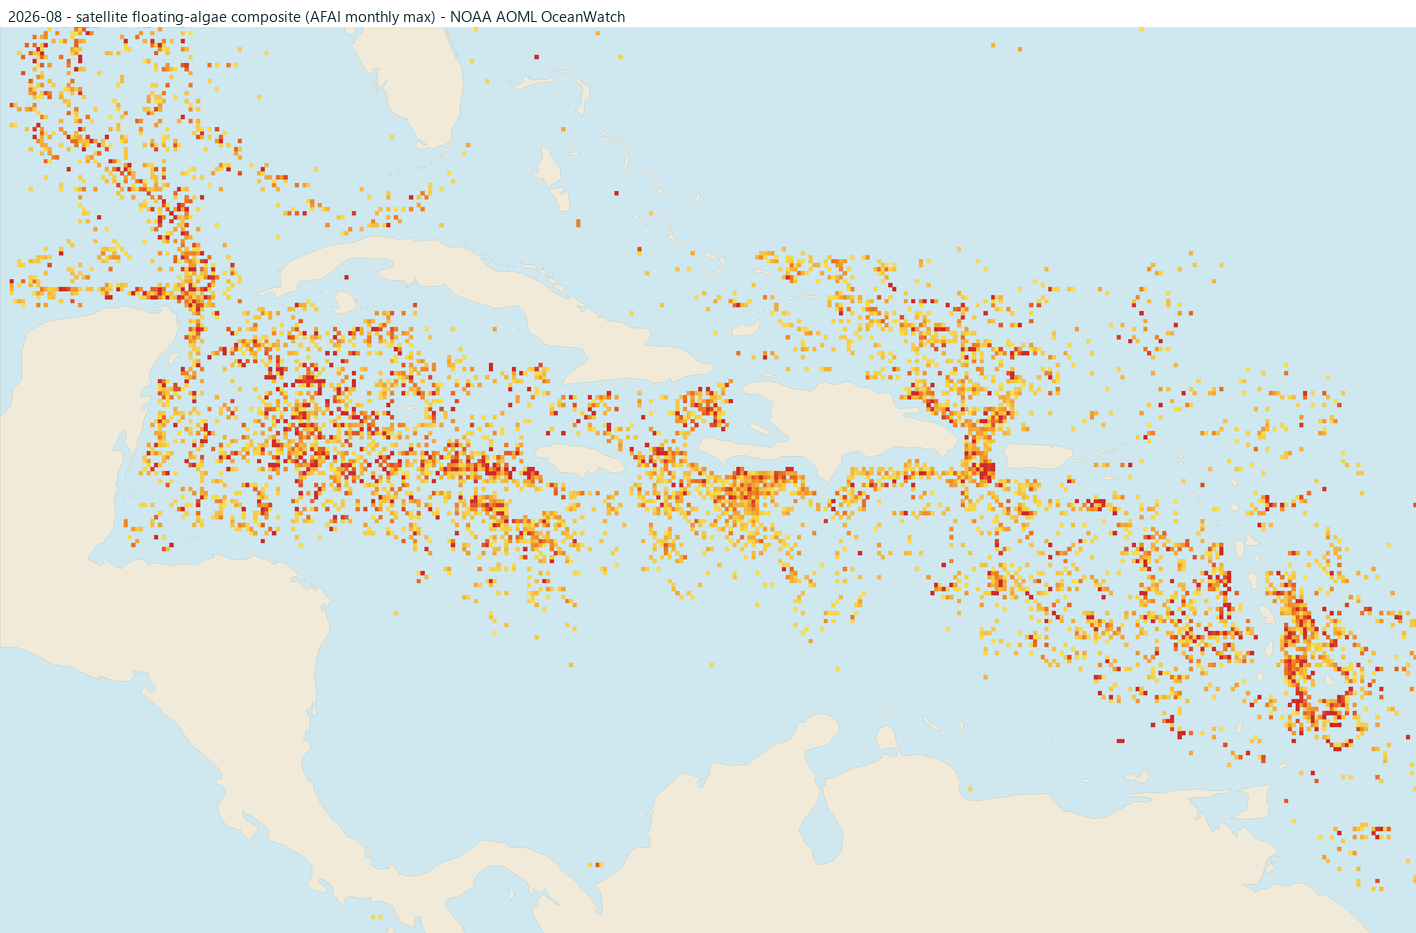
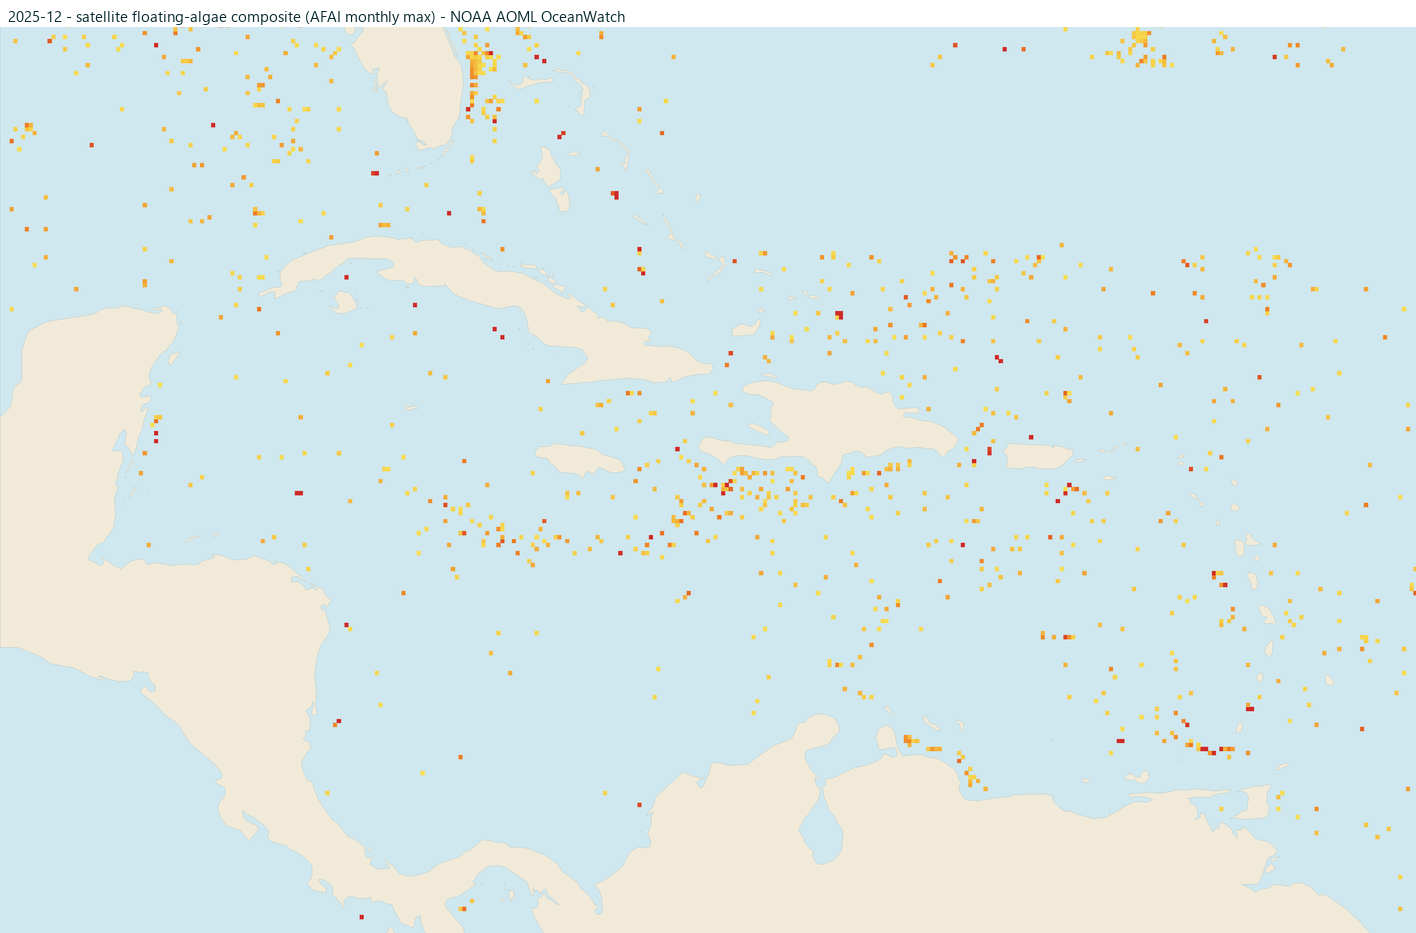
Heads up: NOAA puts this coast in its highest seaweed-risk level for this observation. That raises the odds of seaweed on shore; it is not a verdict. Wind, currents, and cleanup crews decide any given morning, and travelers regularly find clear sand on High days. It measures seaweed approaching offshore, not what is on the sand right now; check a cam below for that.
Based on NOAA's update from .
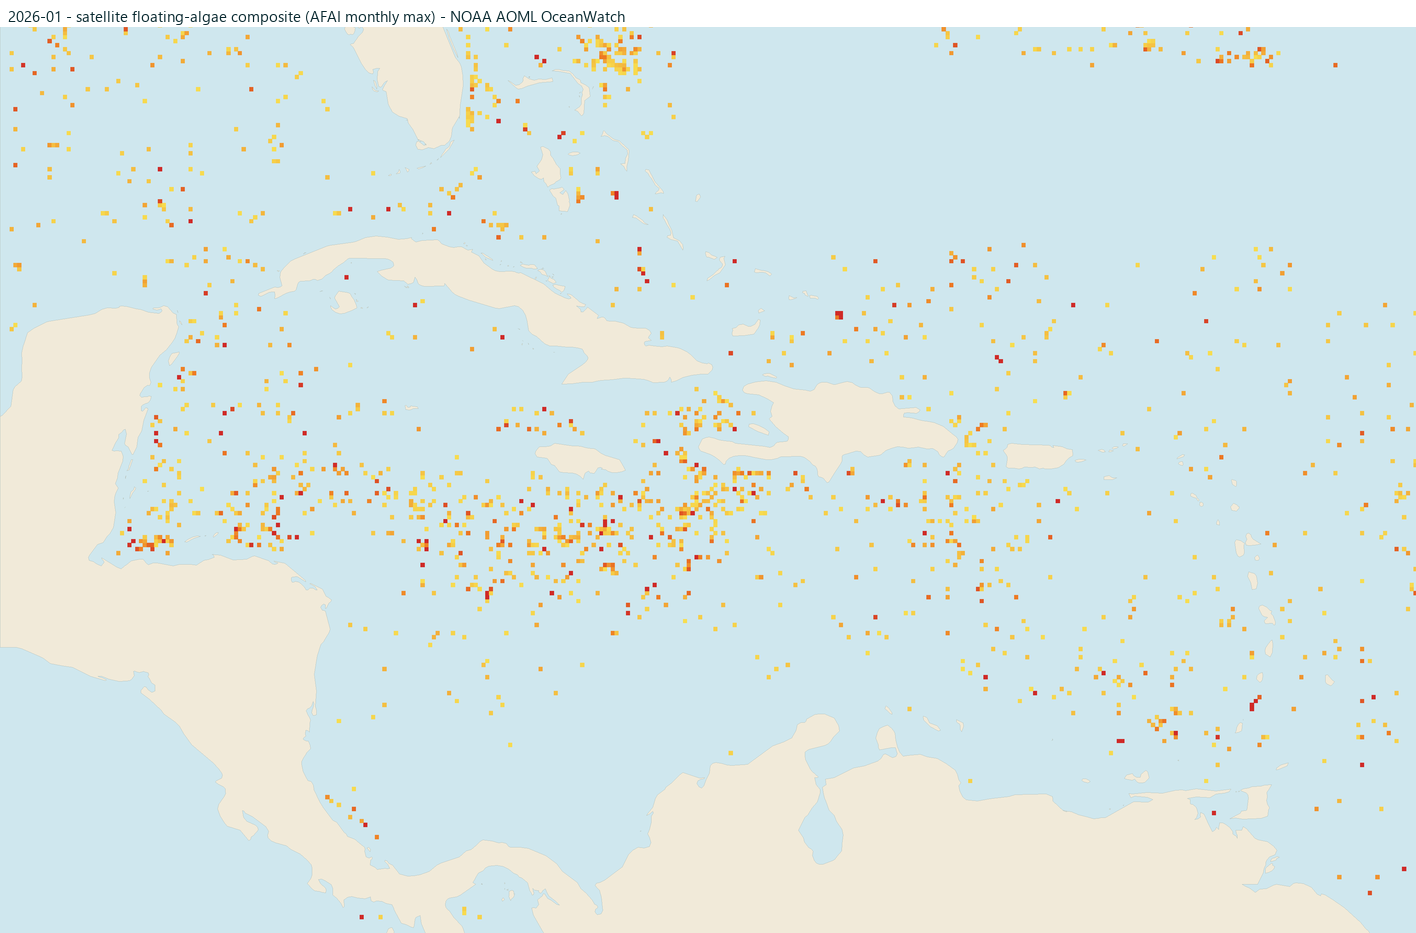
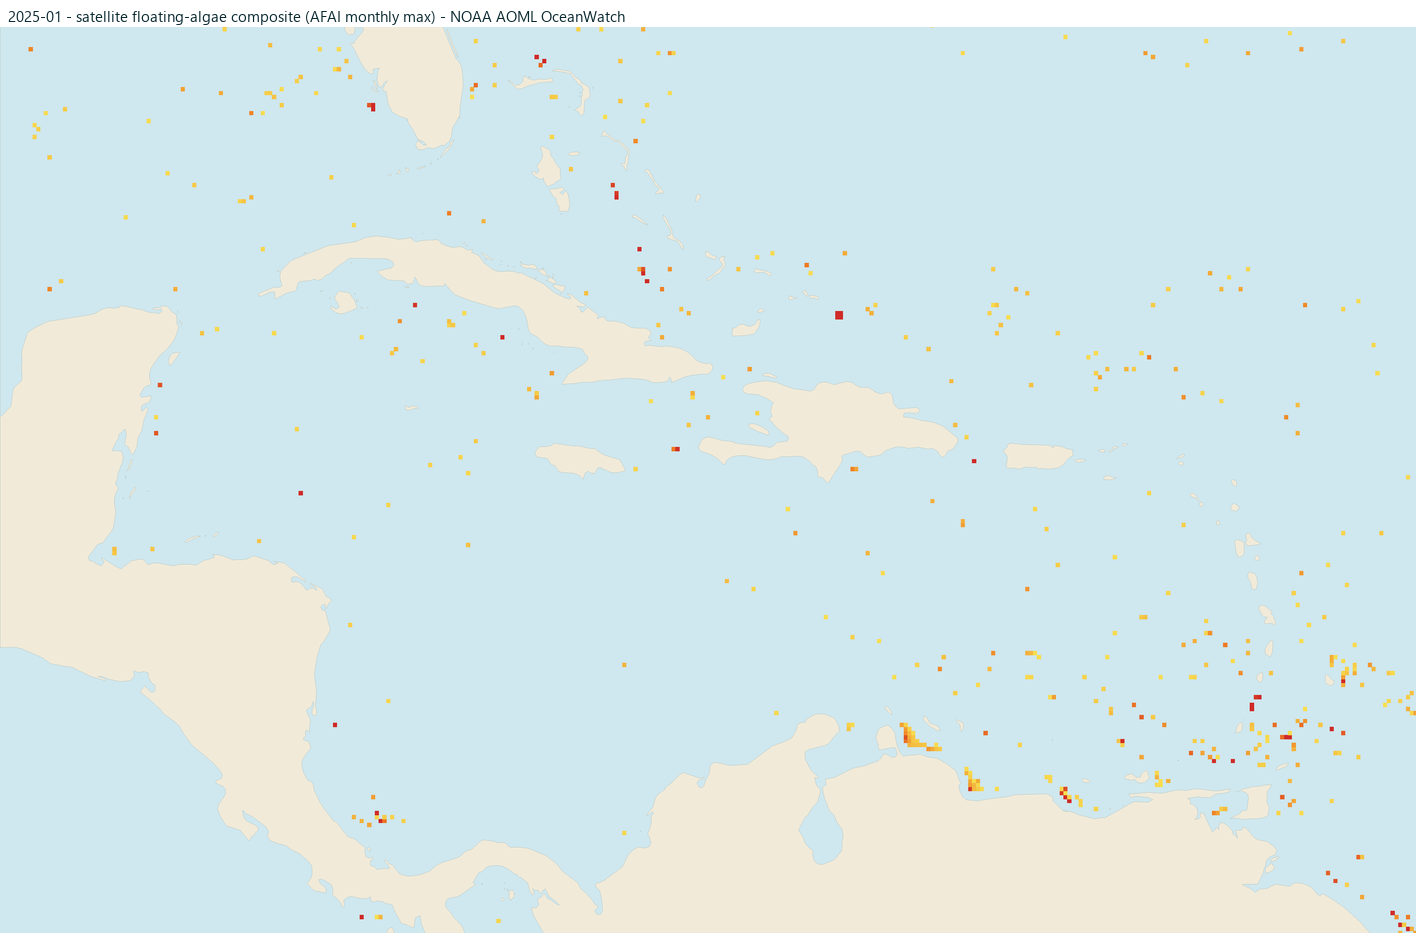
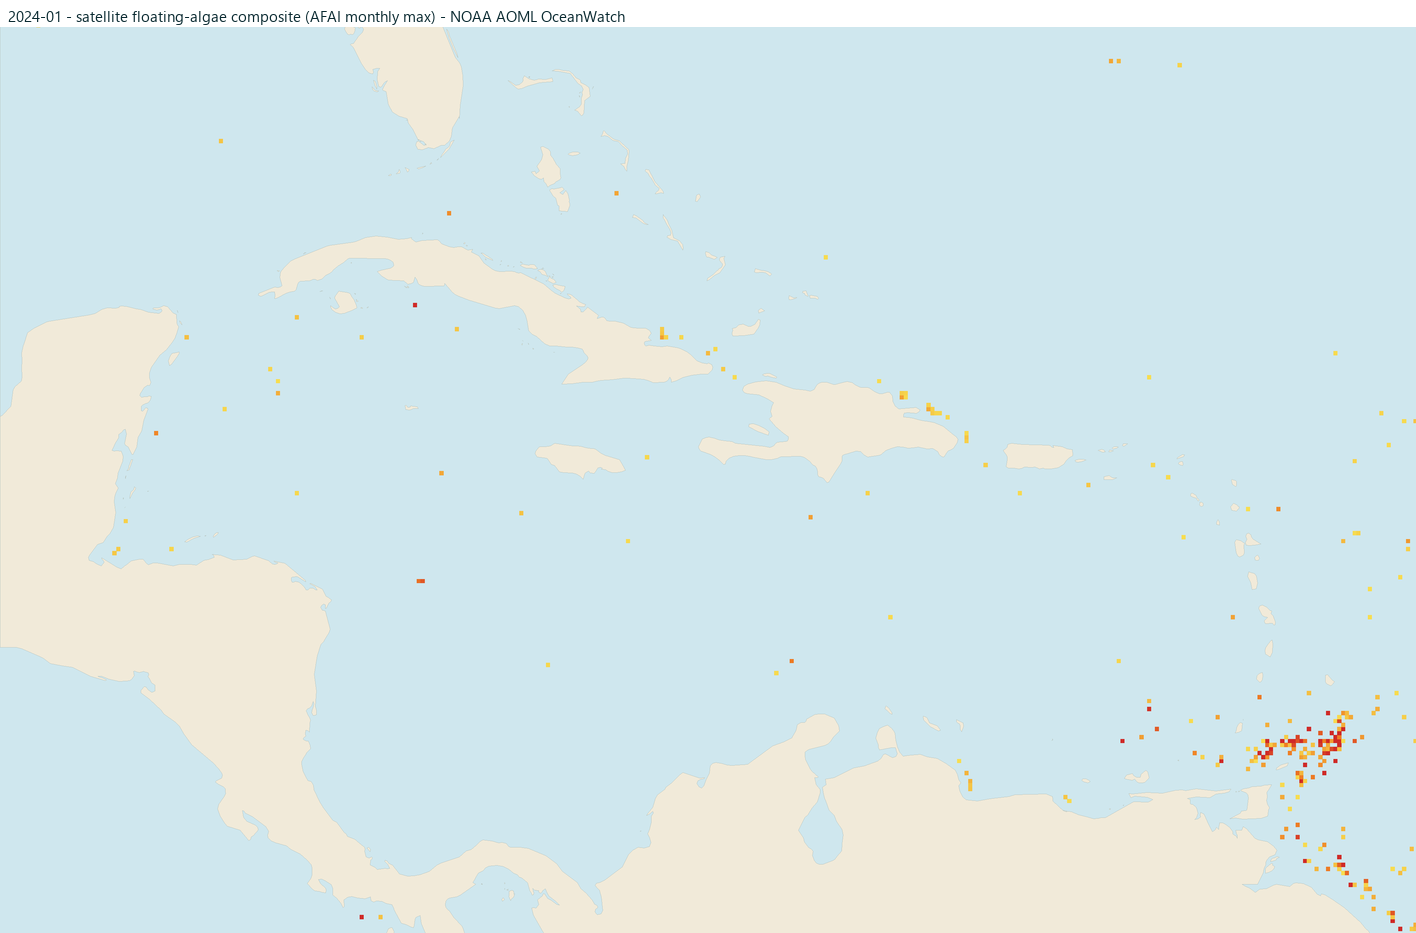
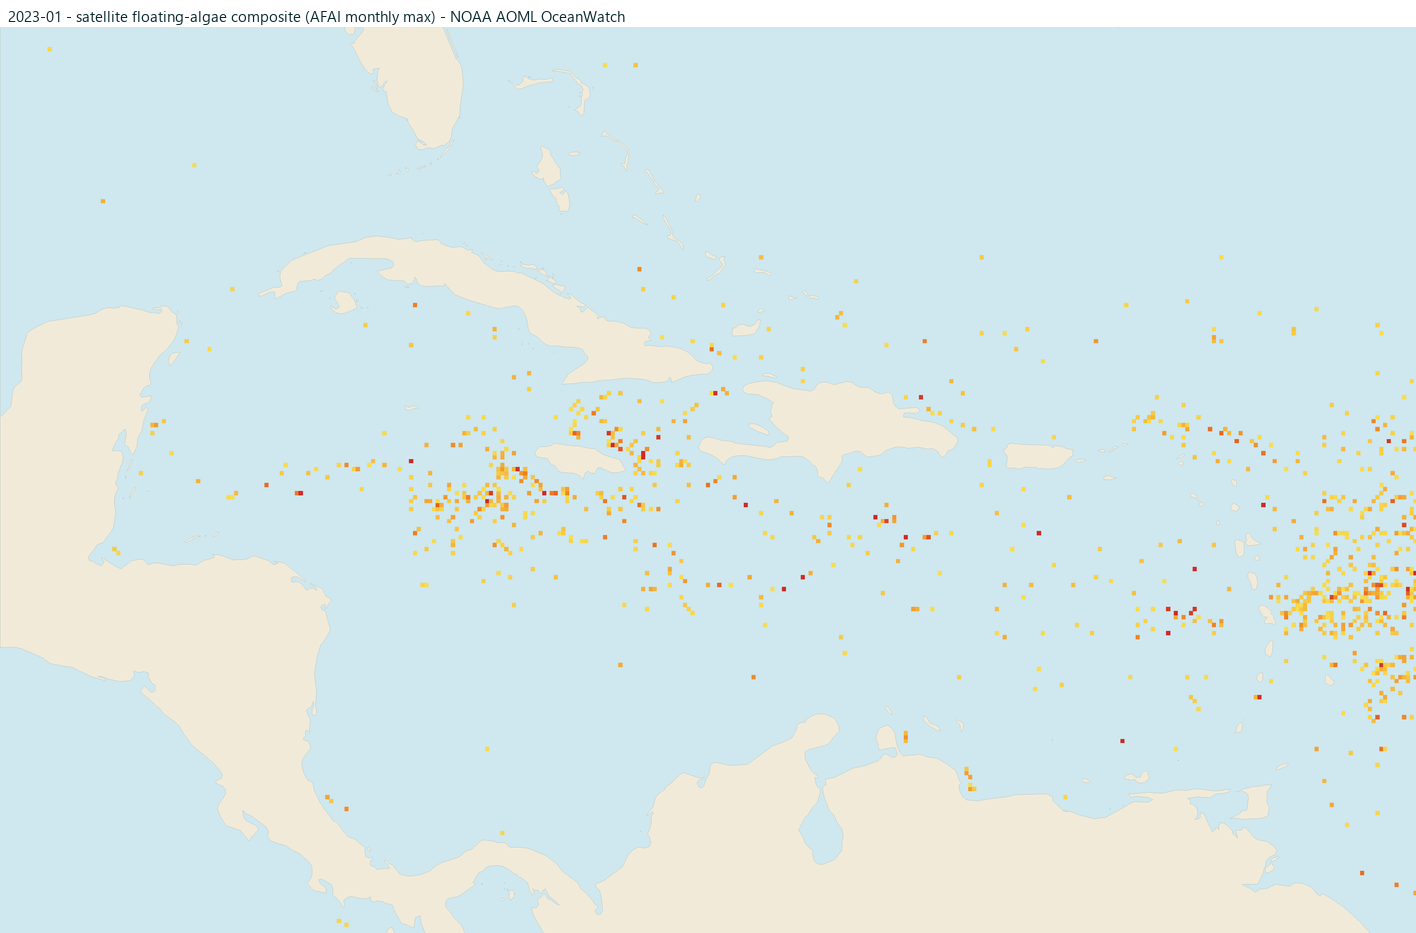
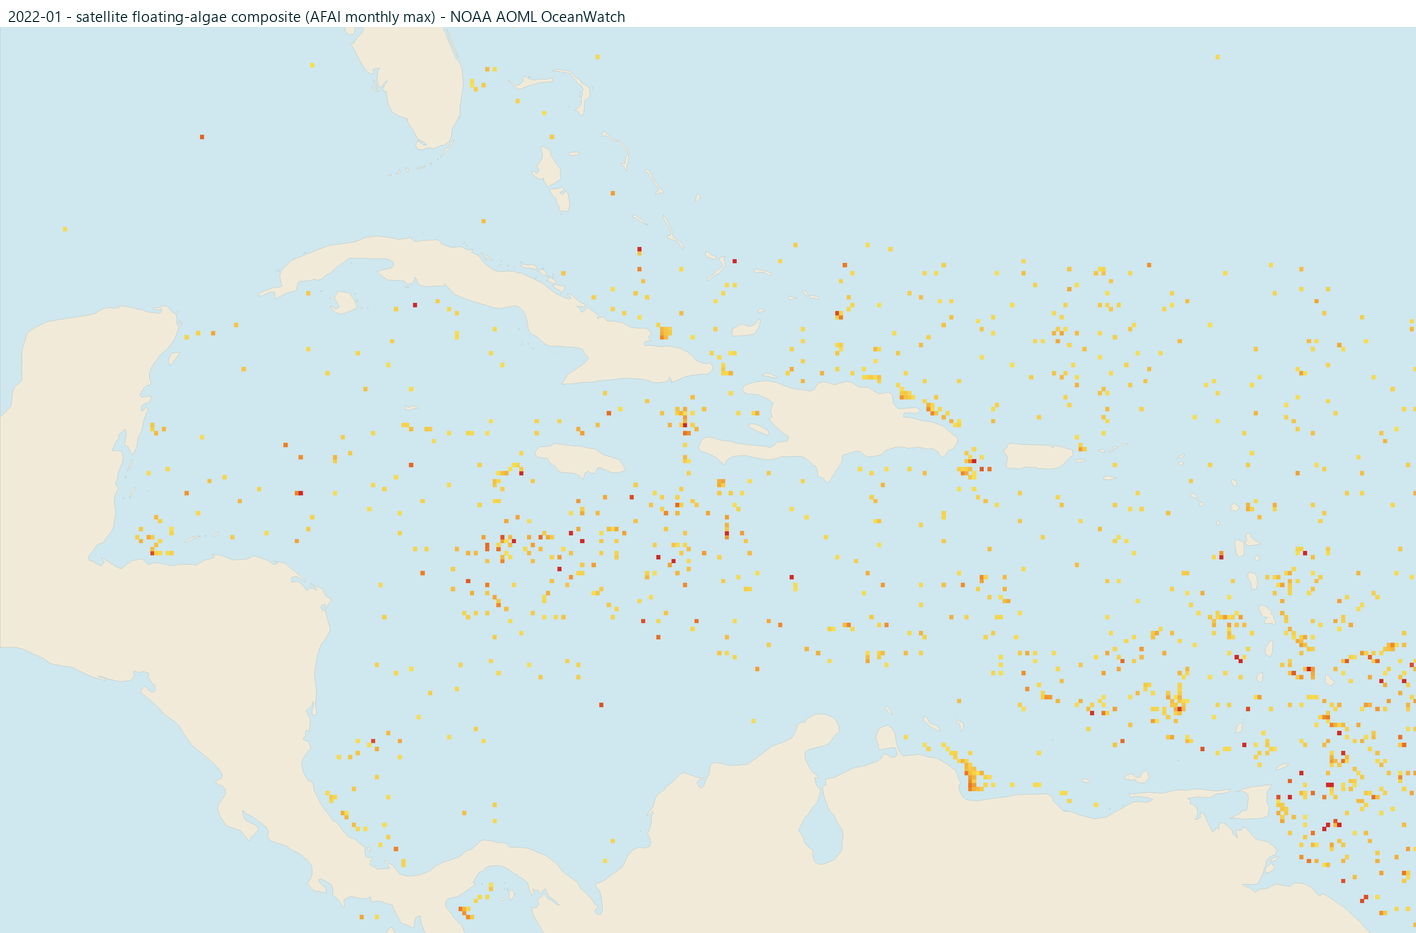
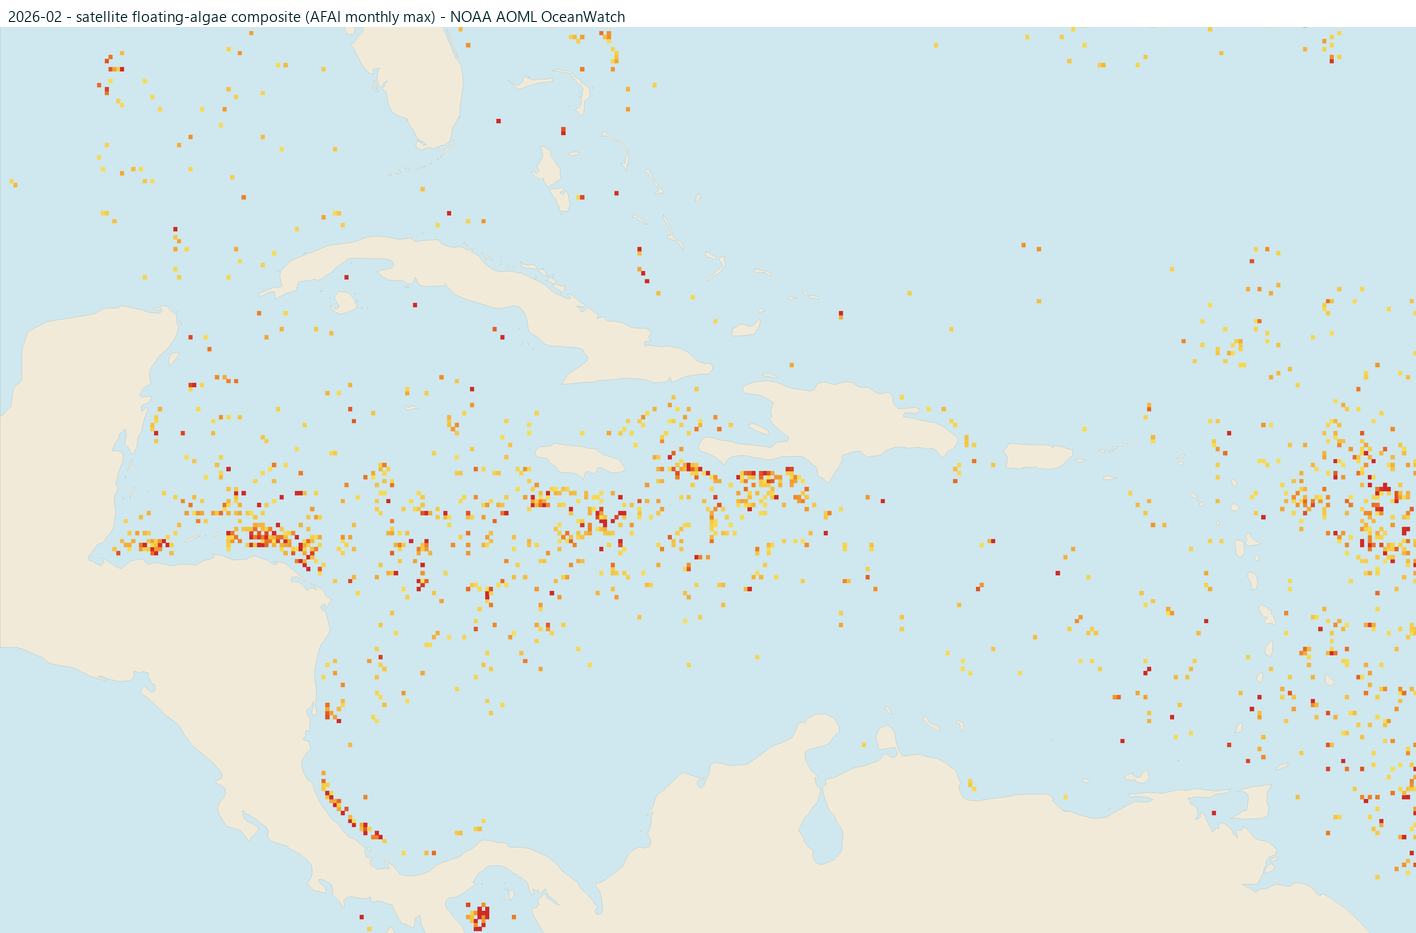
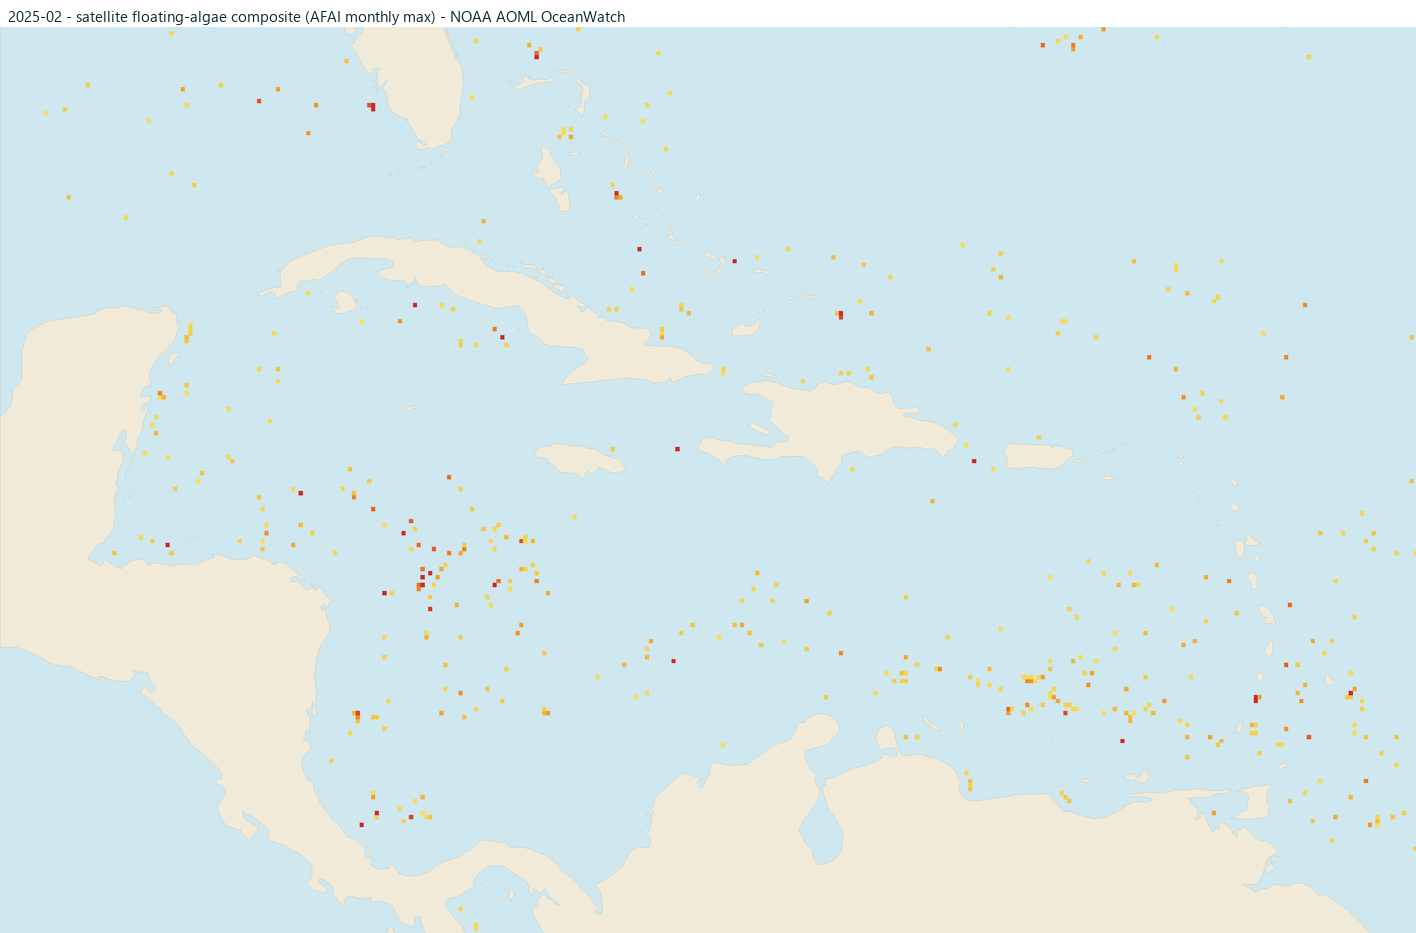
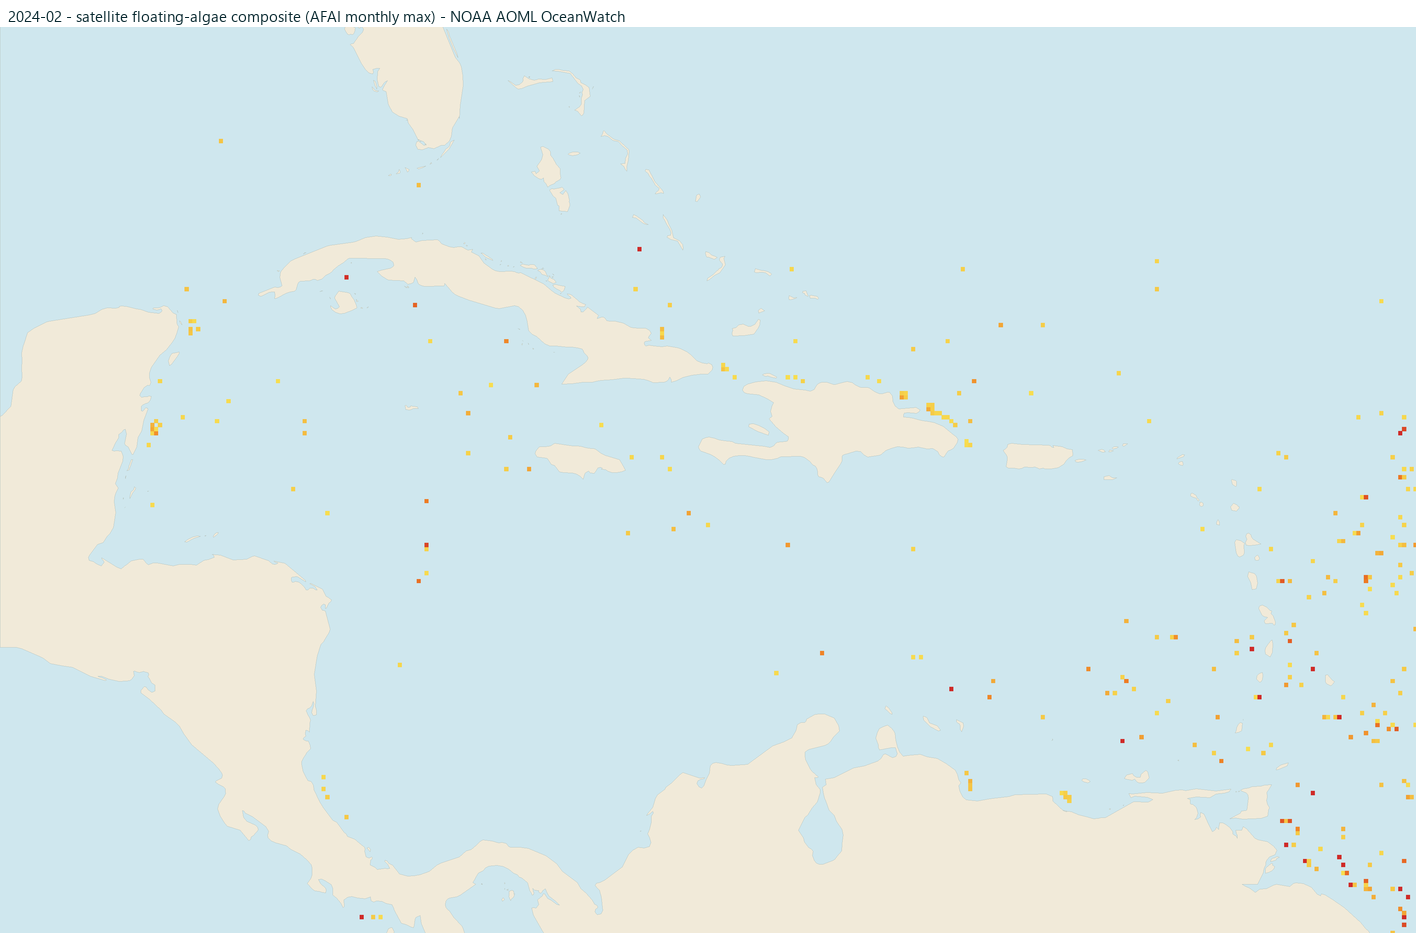
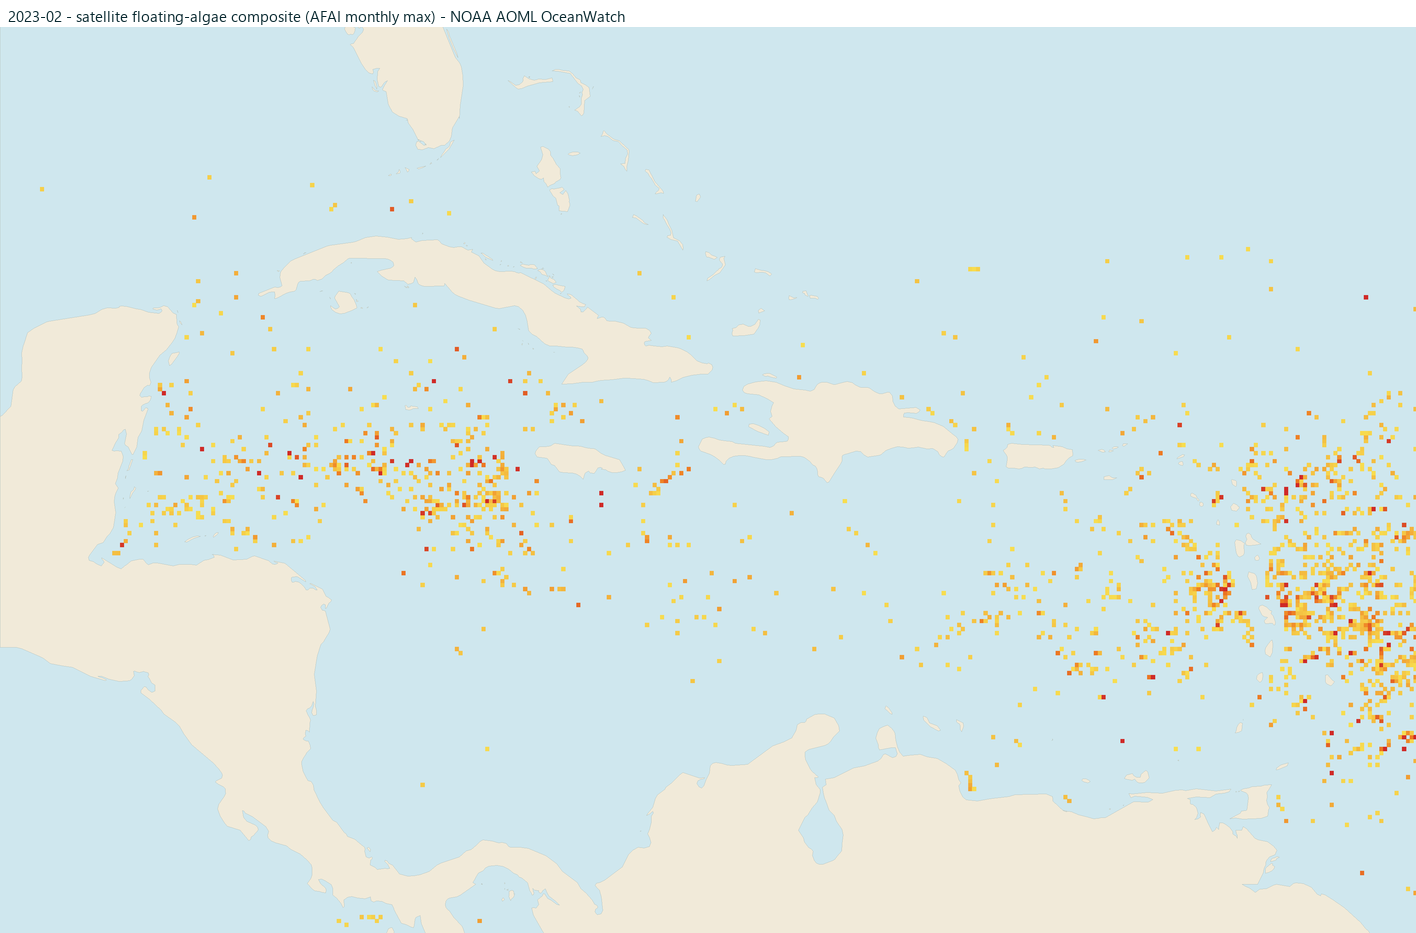
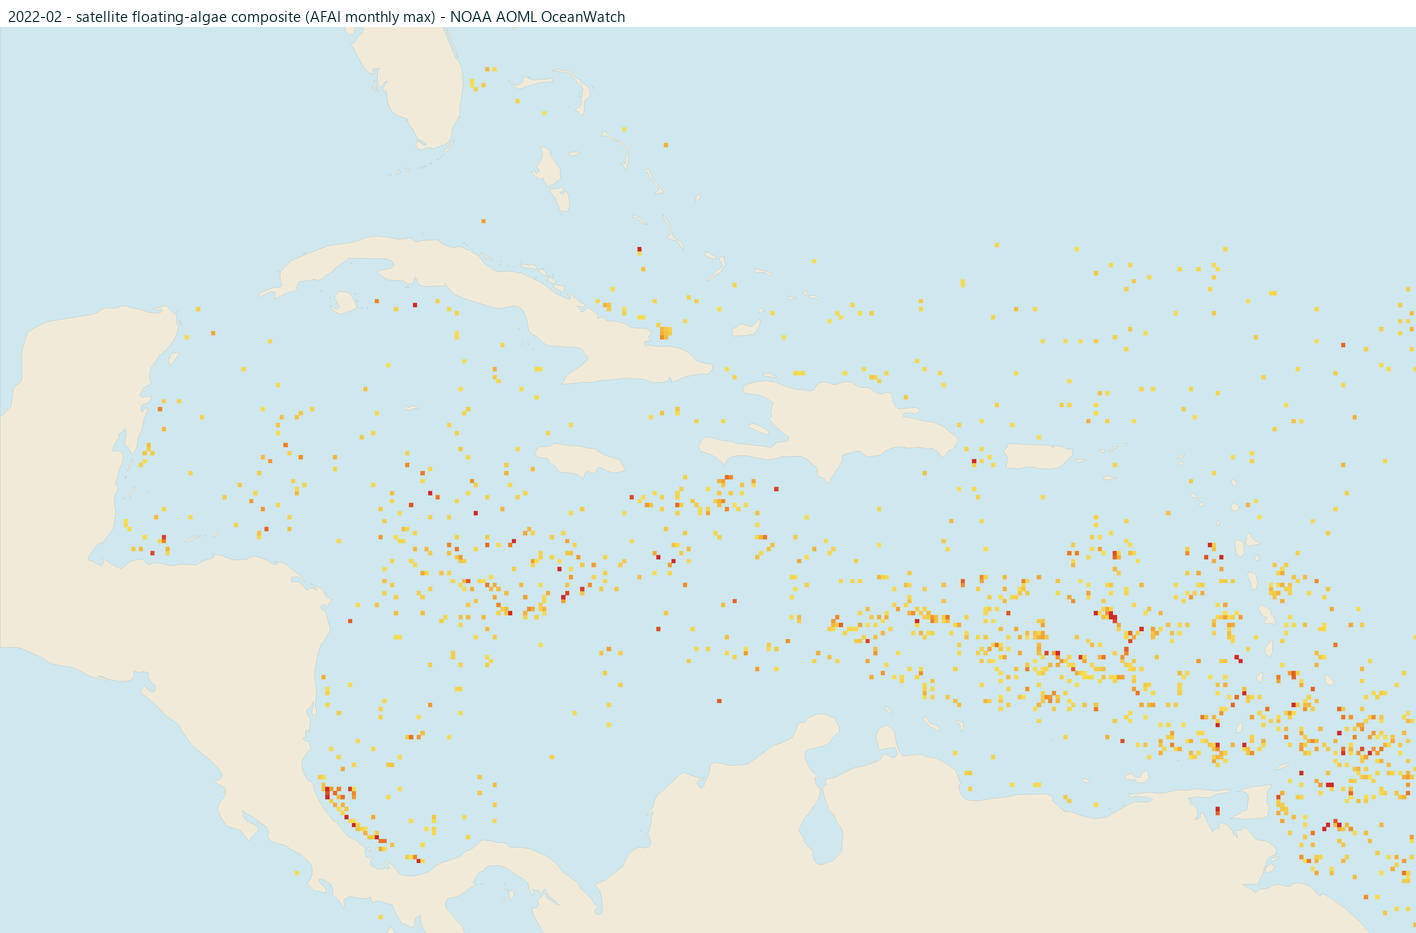
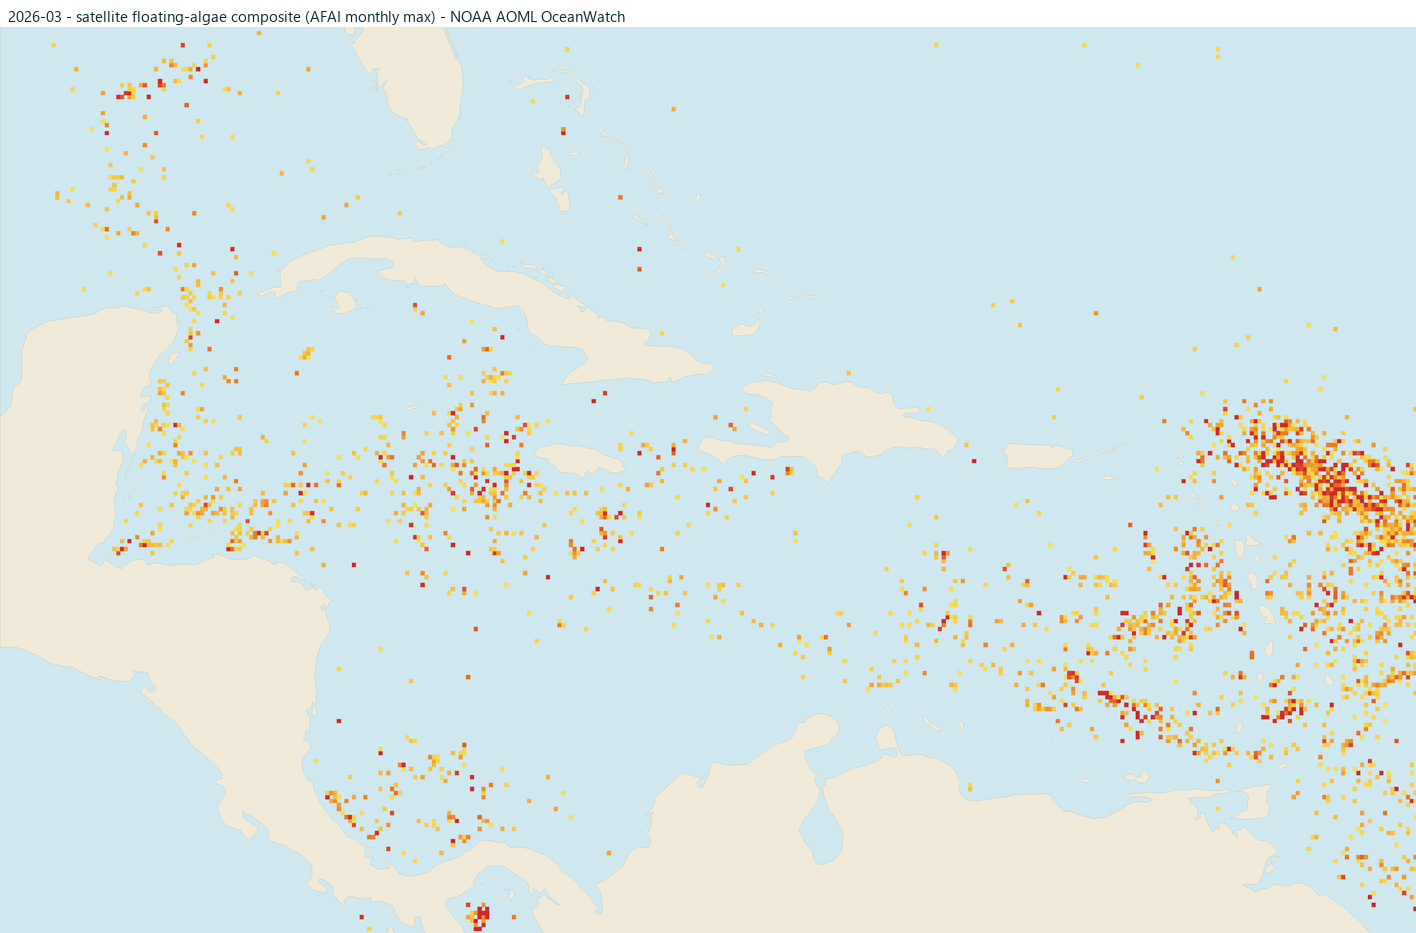
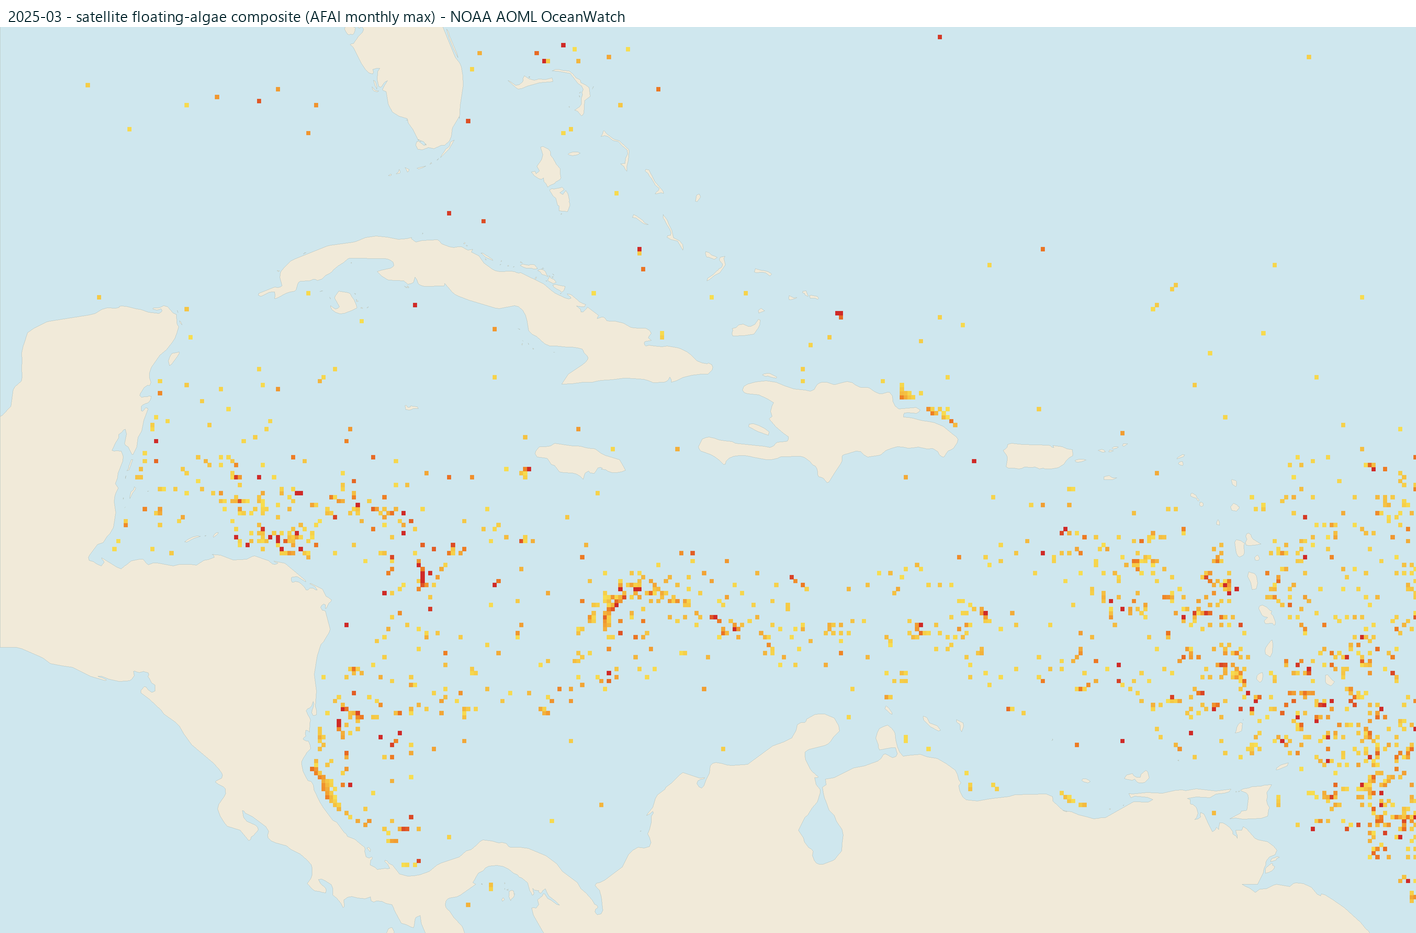
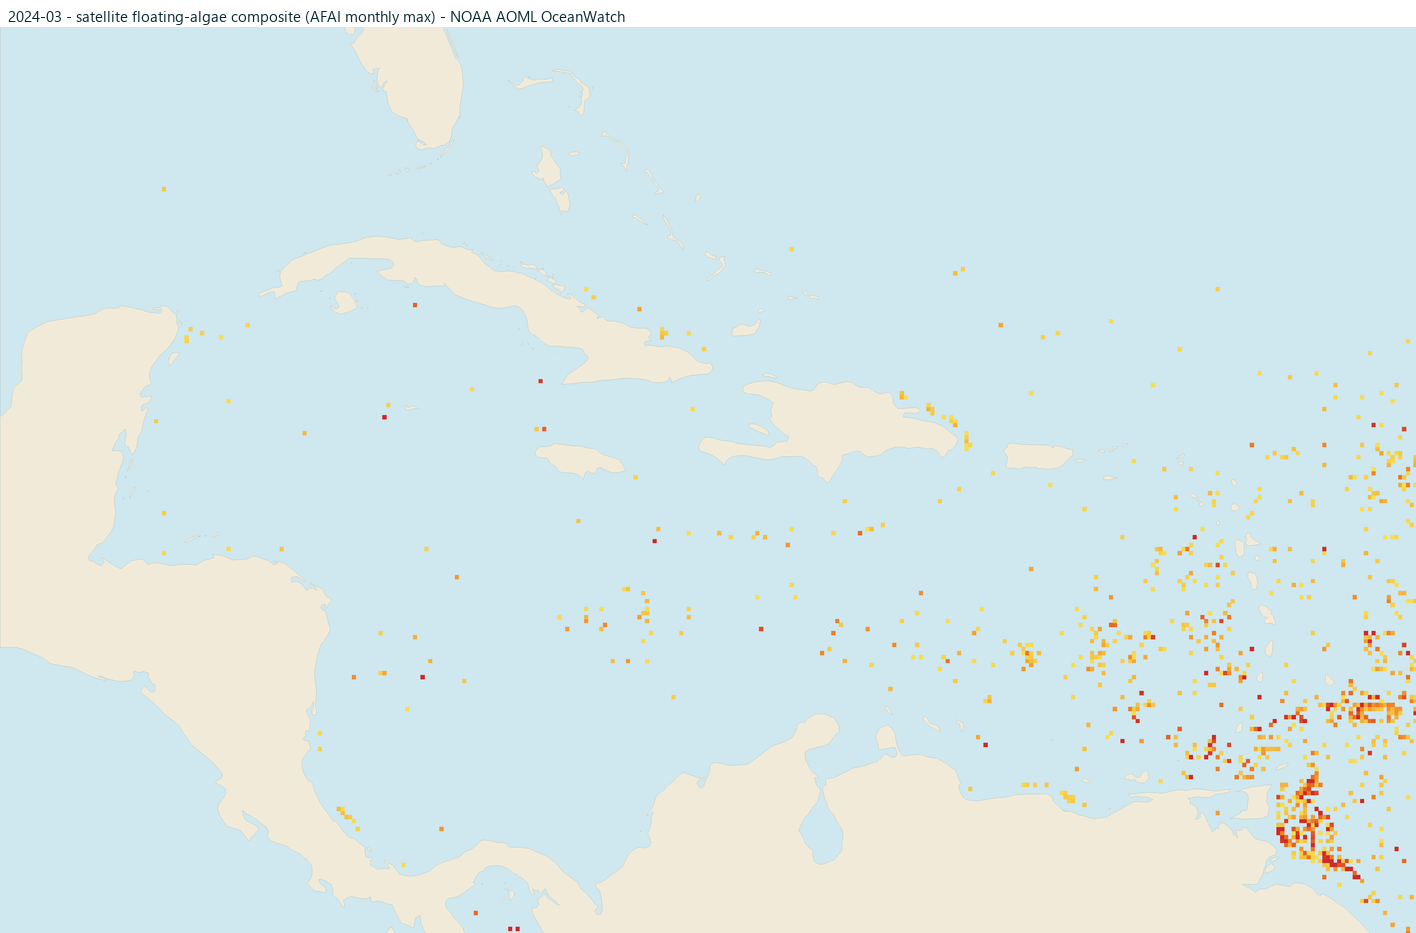
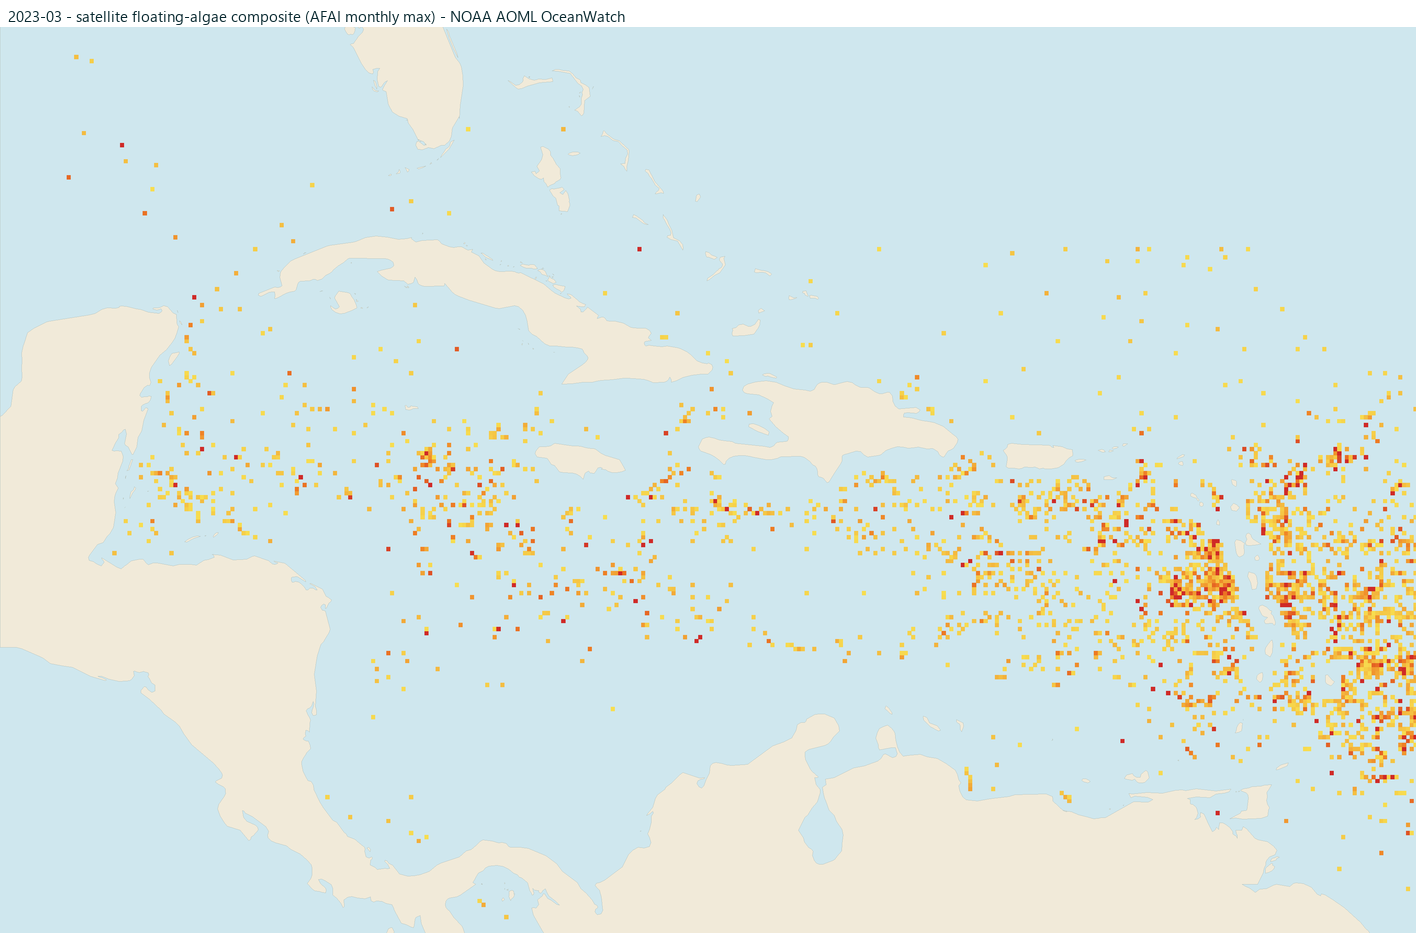
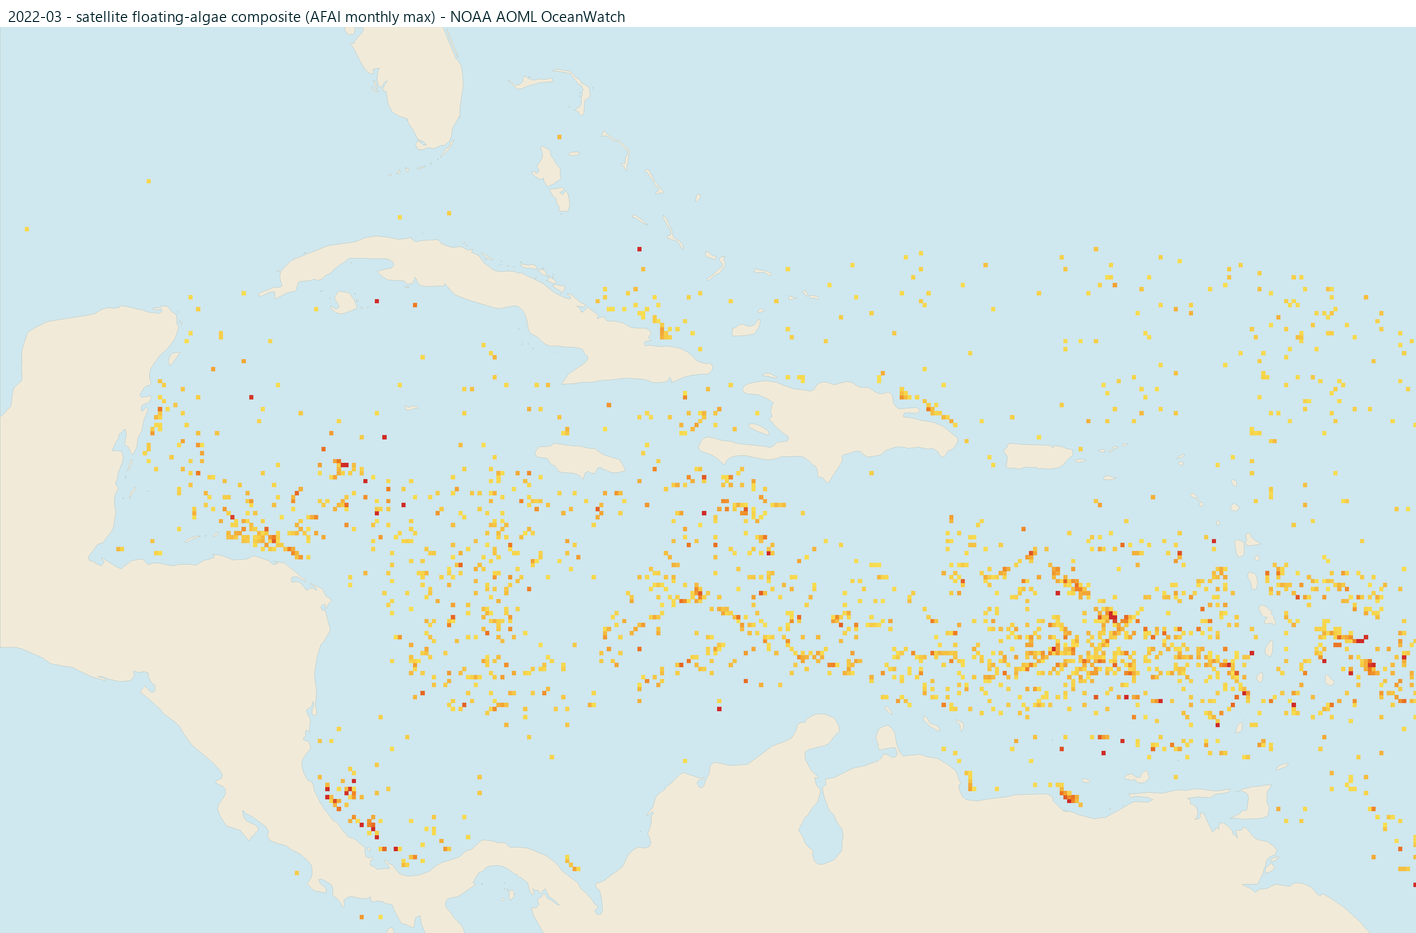
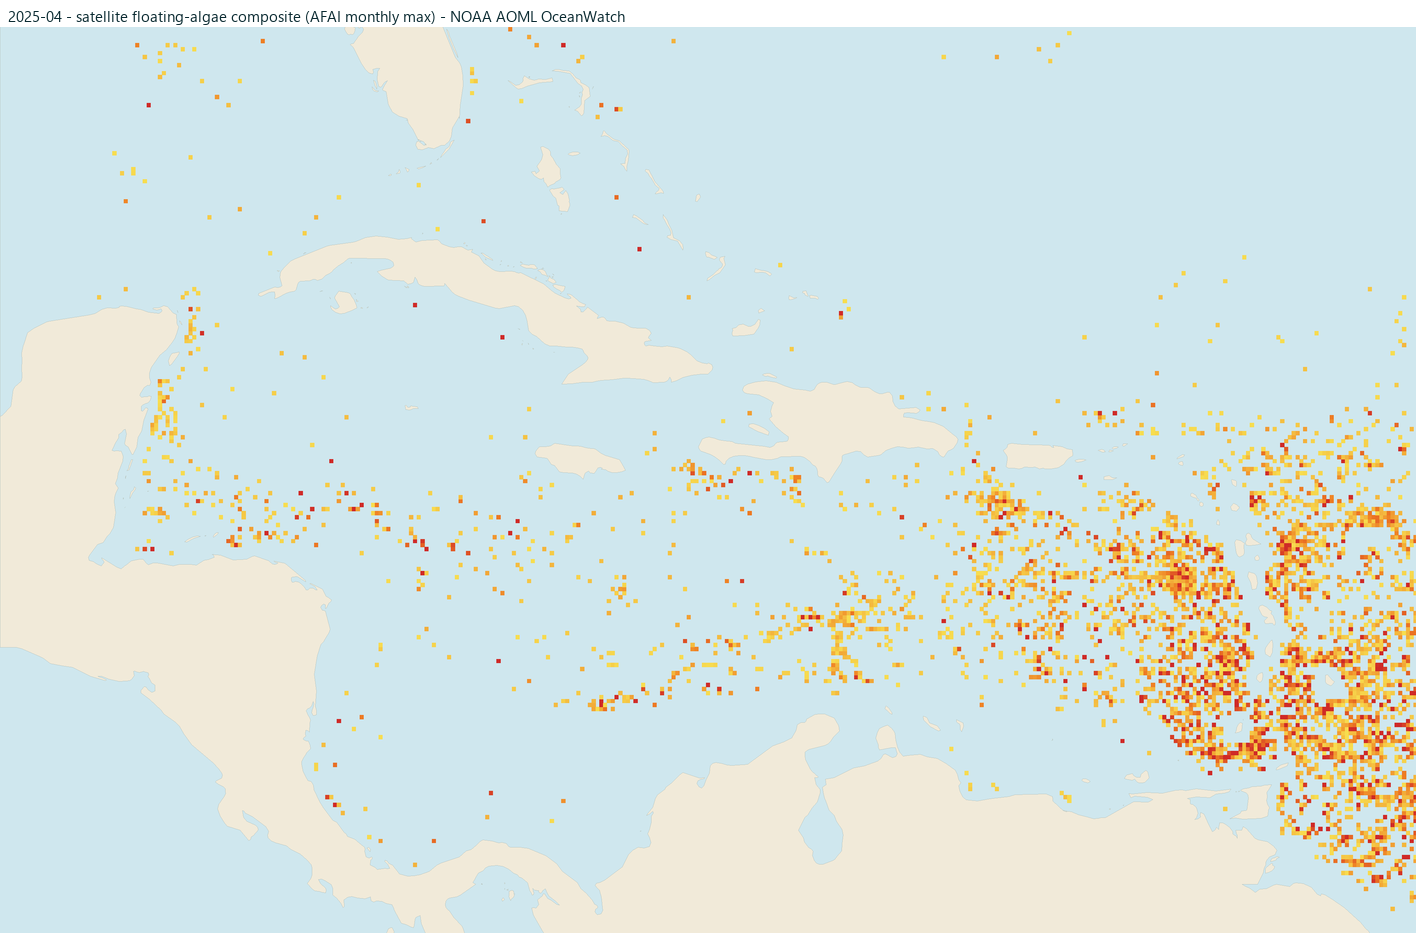
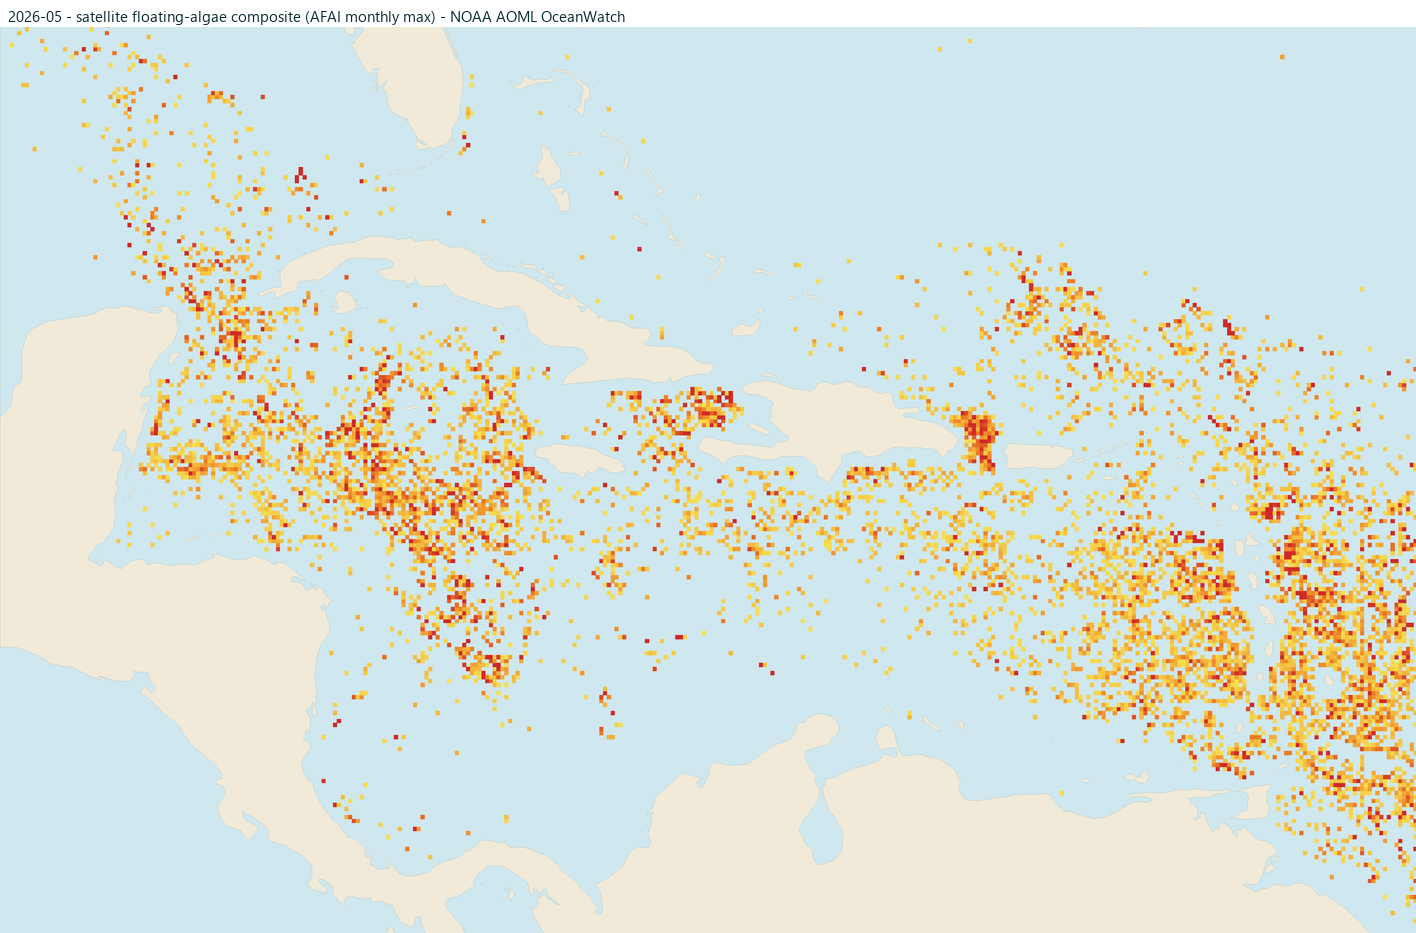
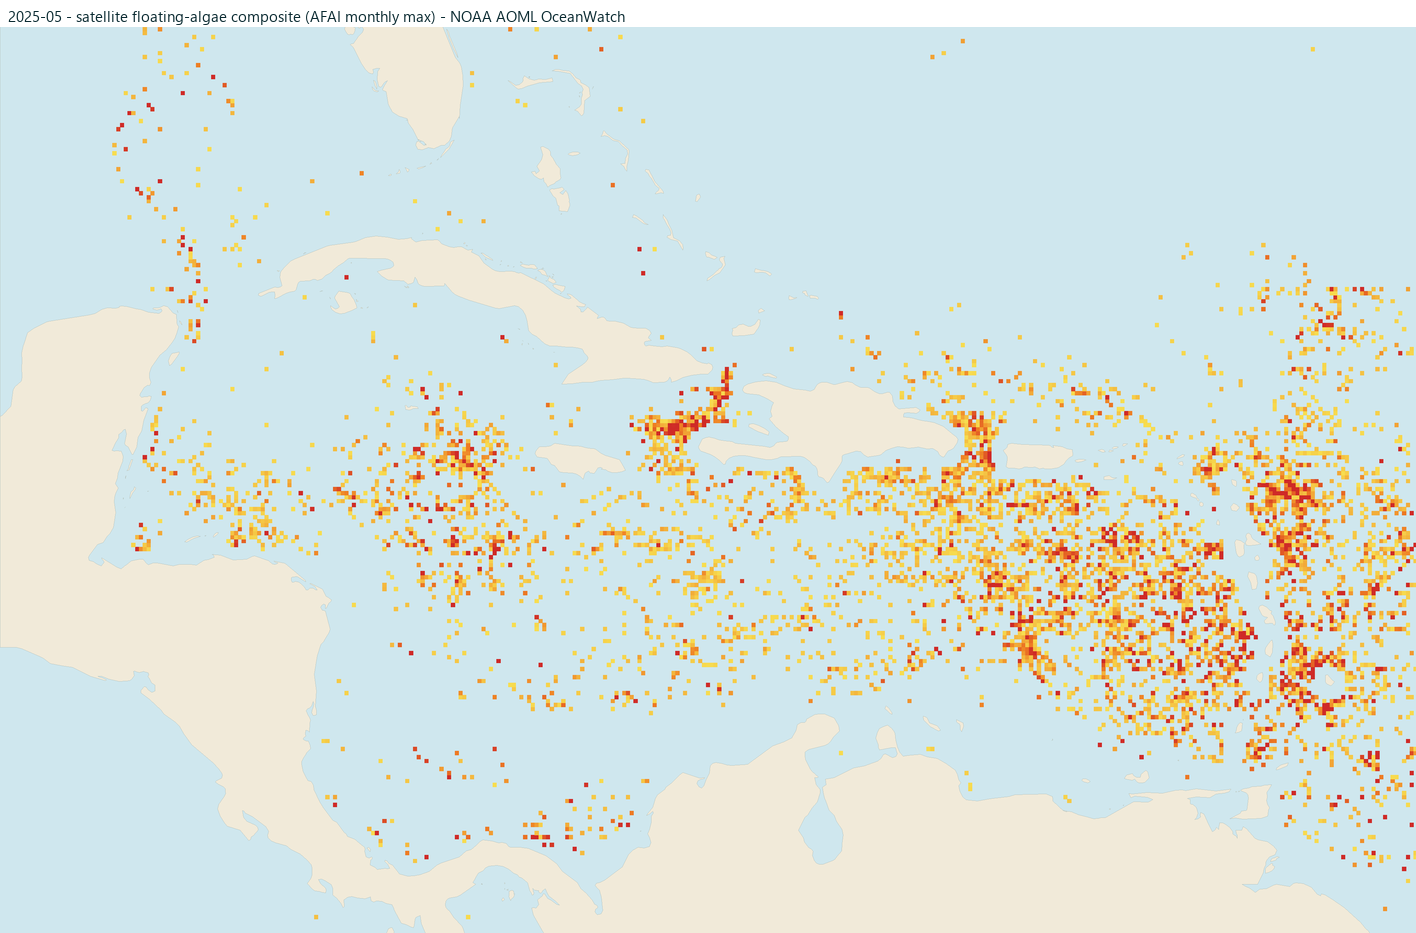
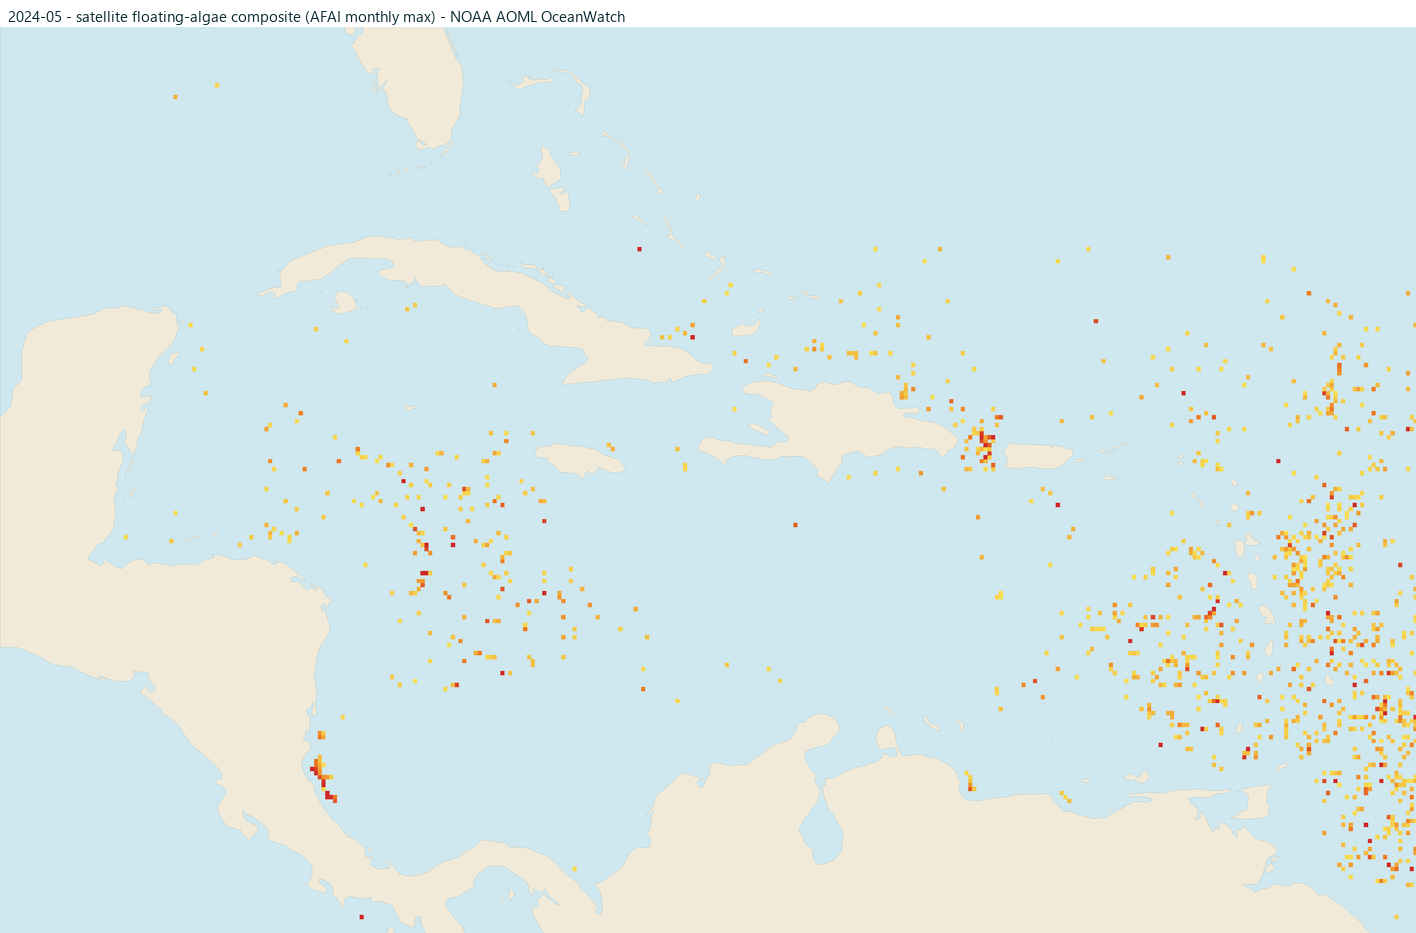
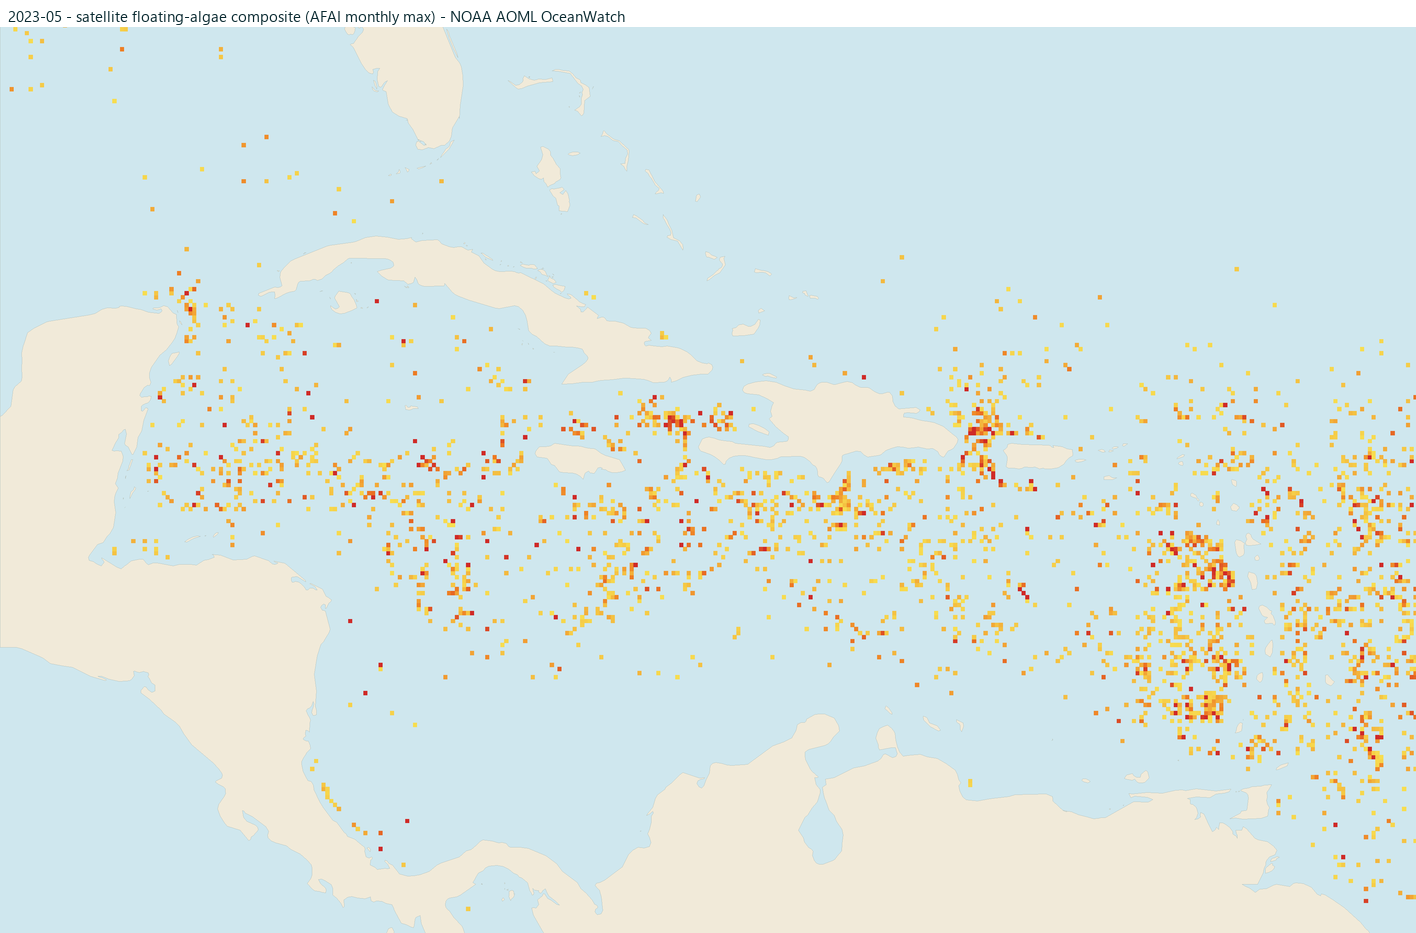
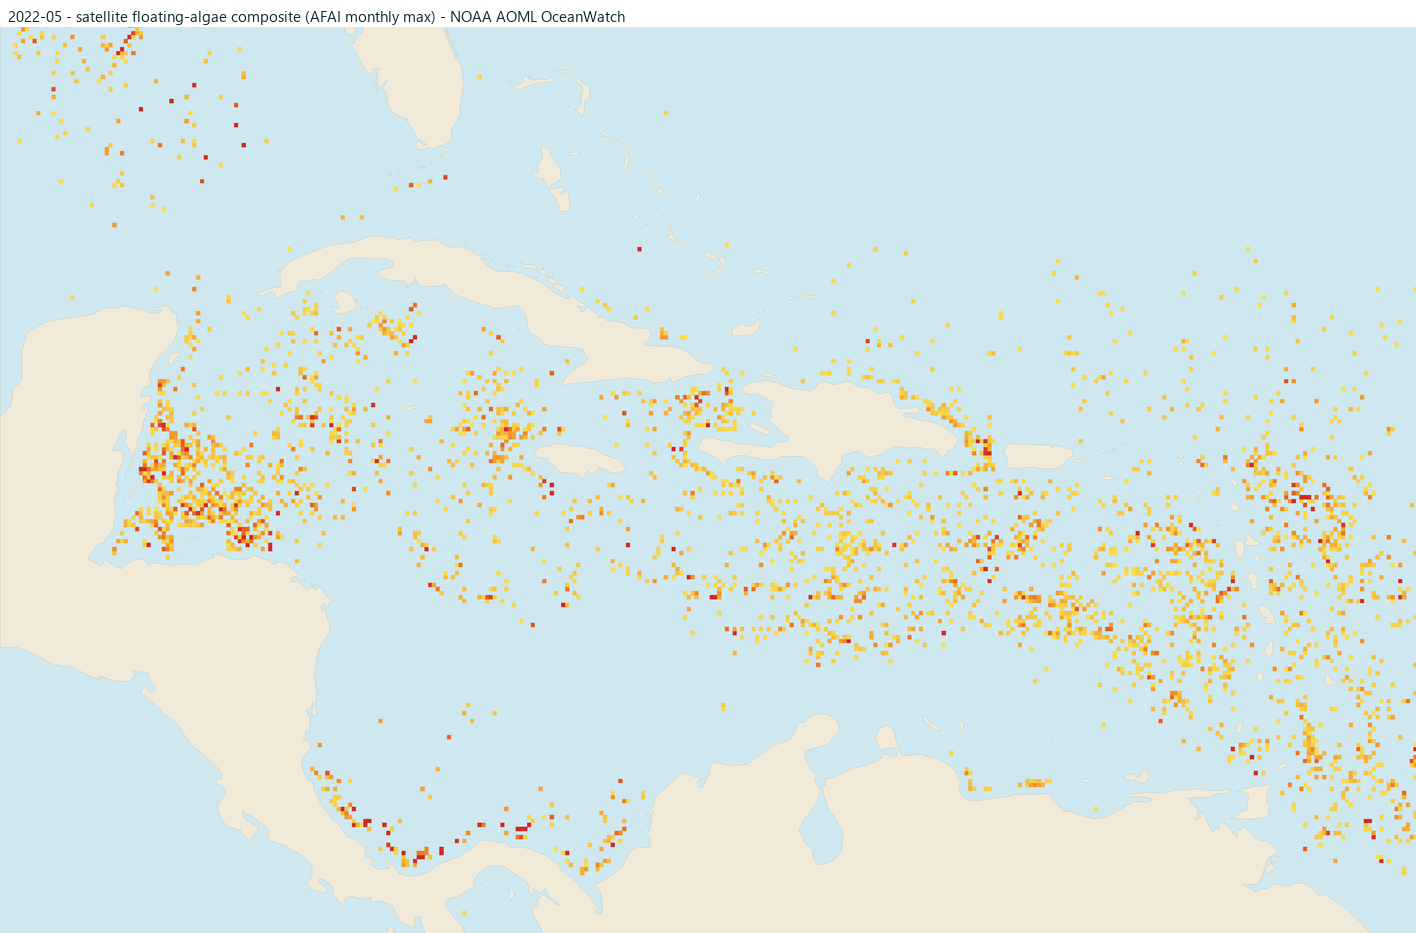
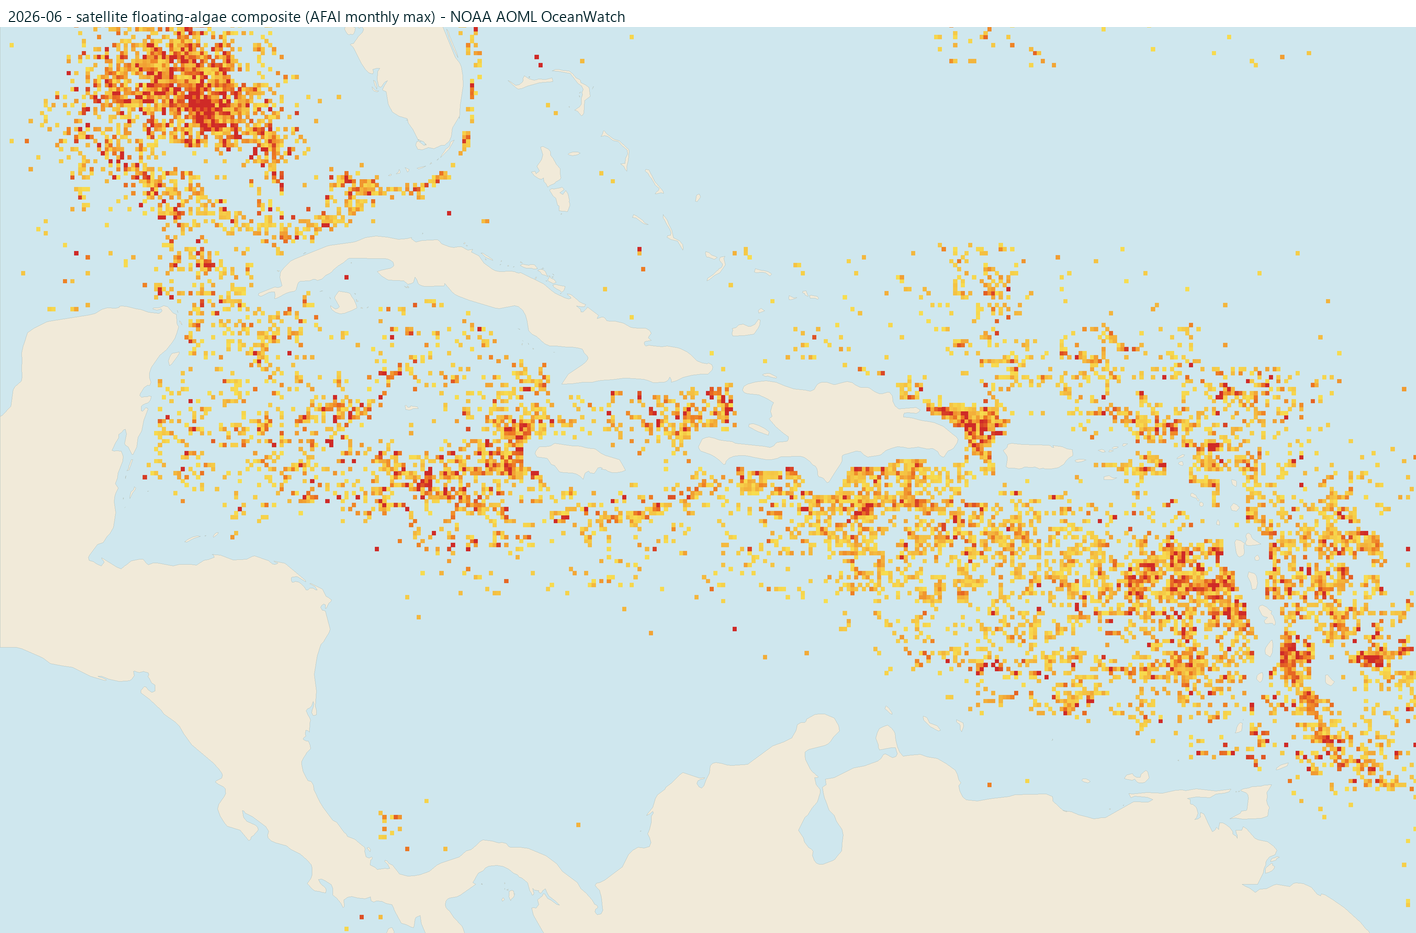
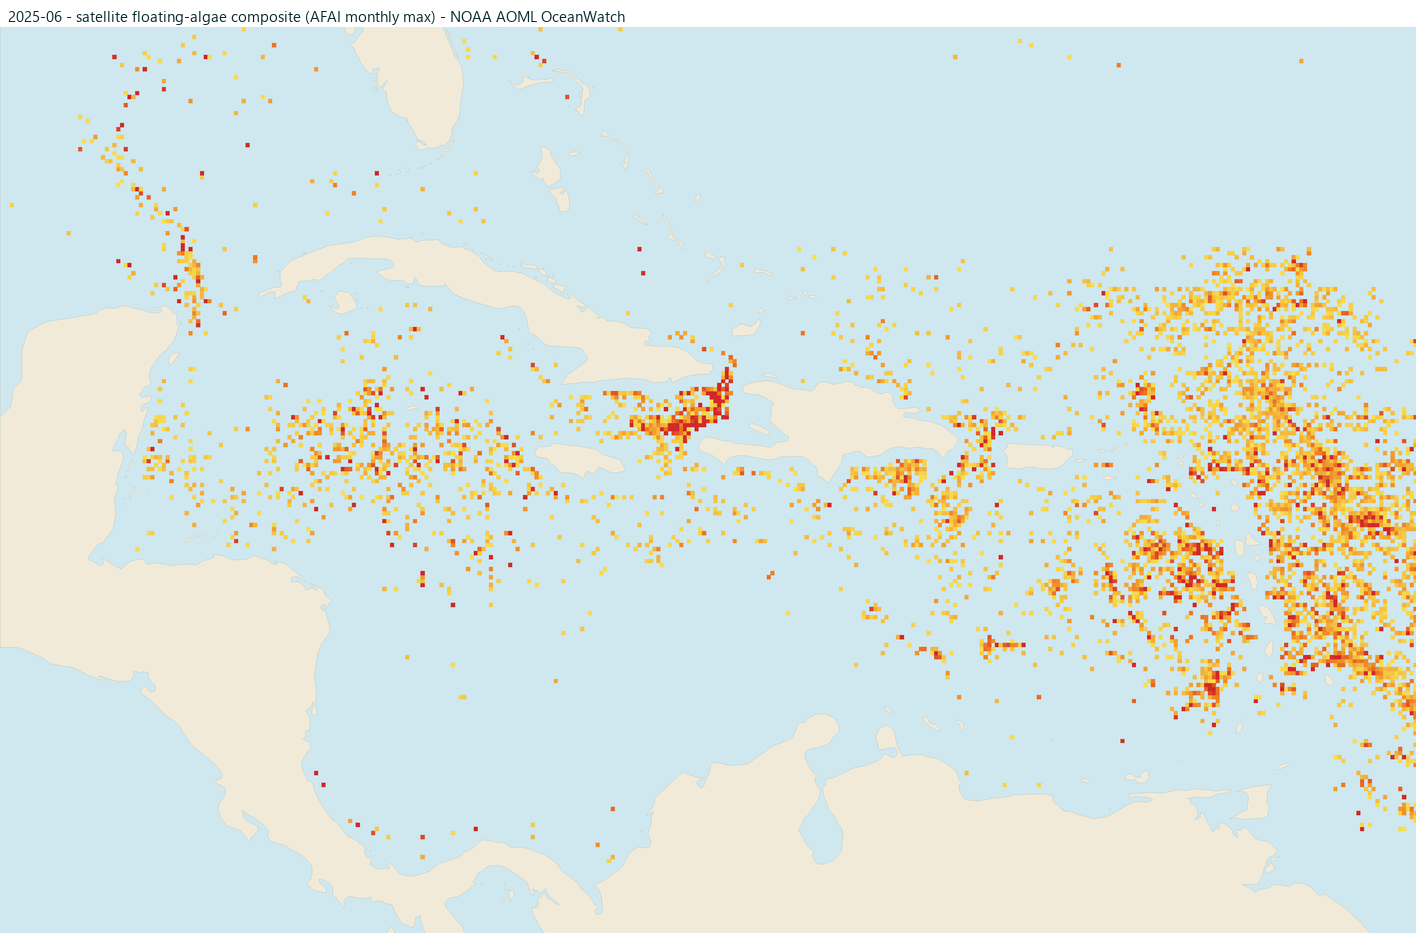
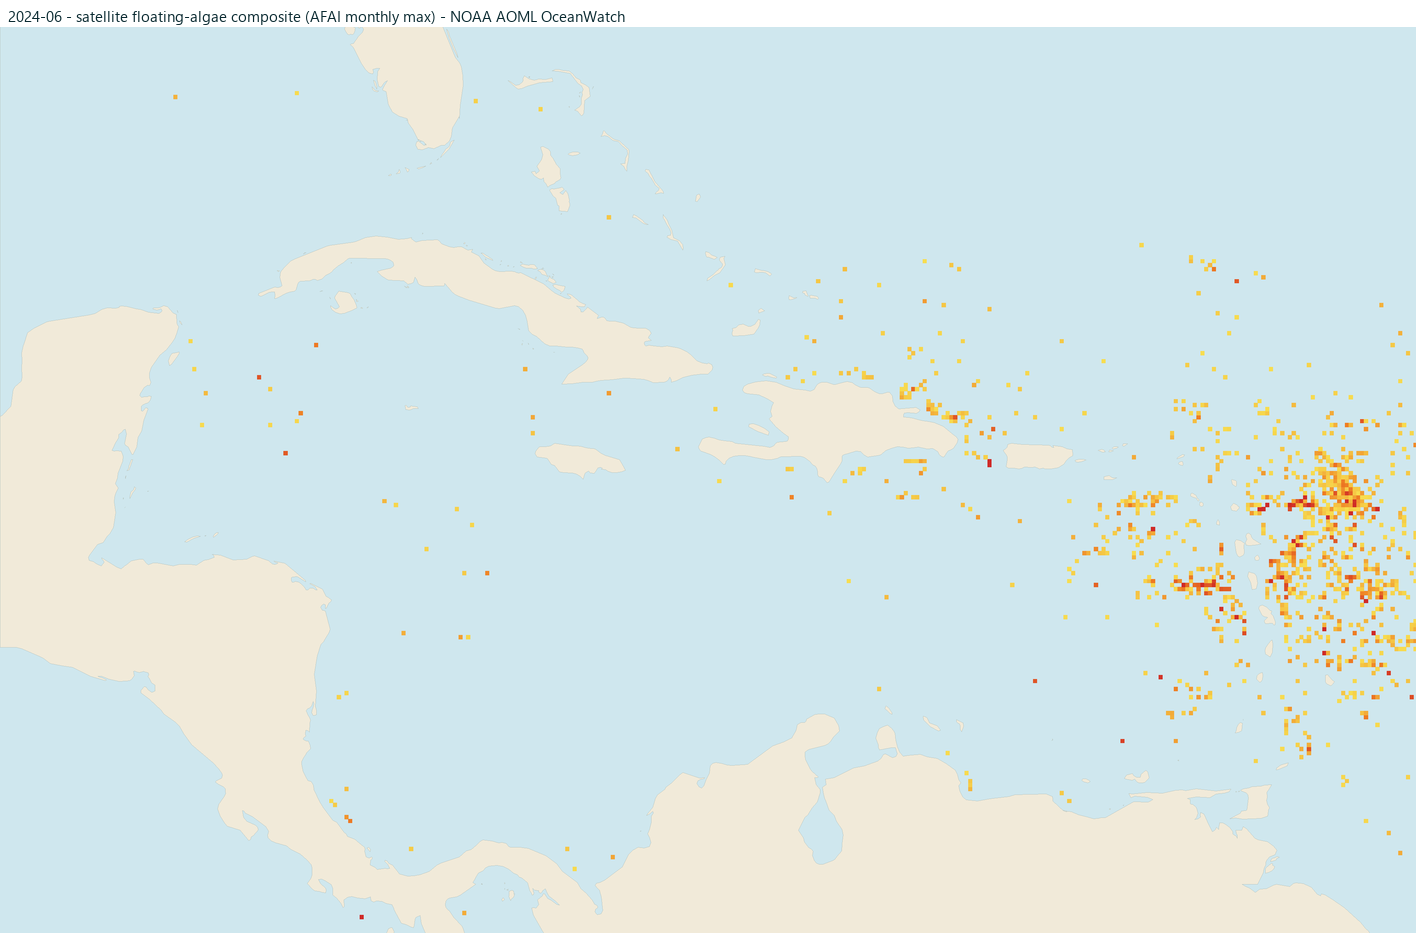
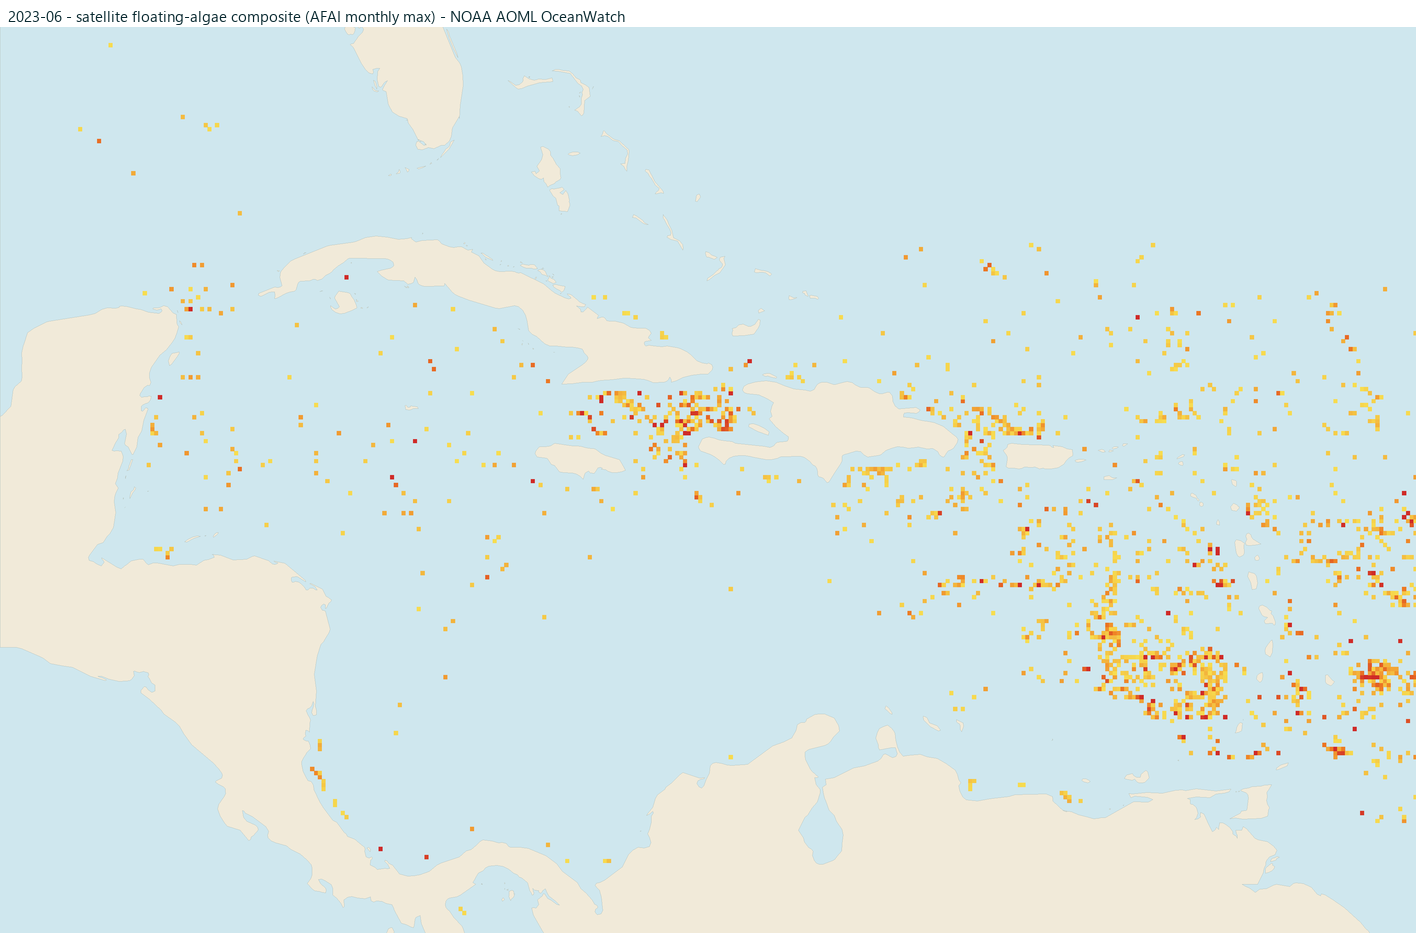
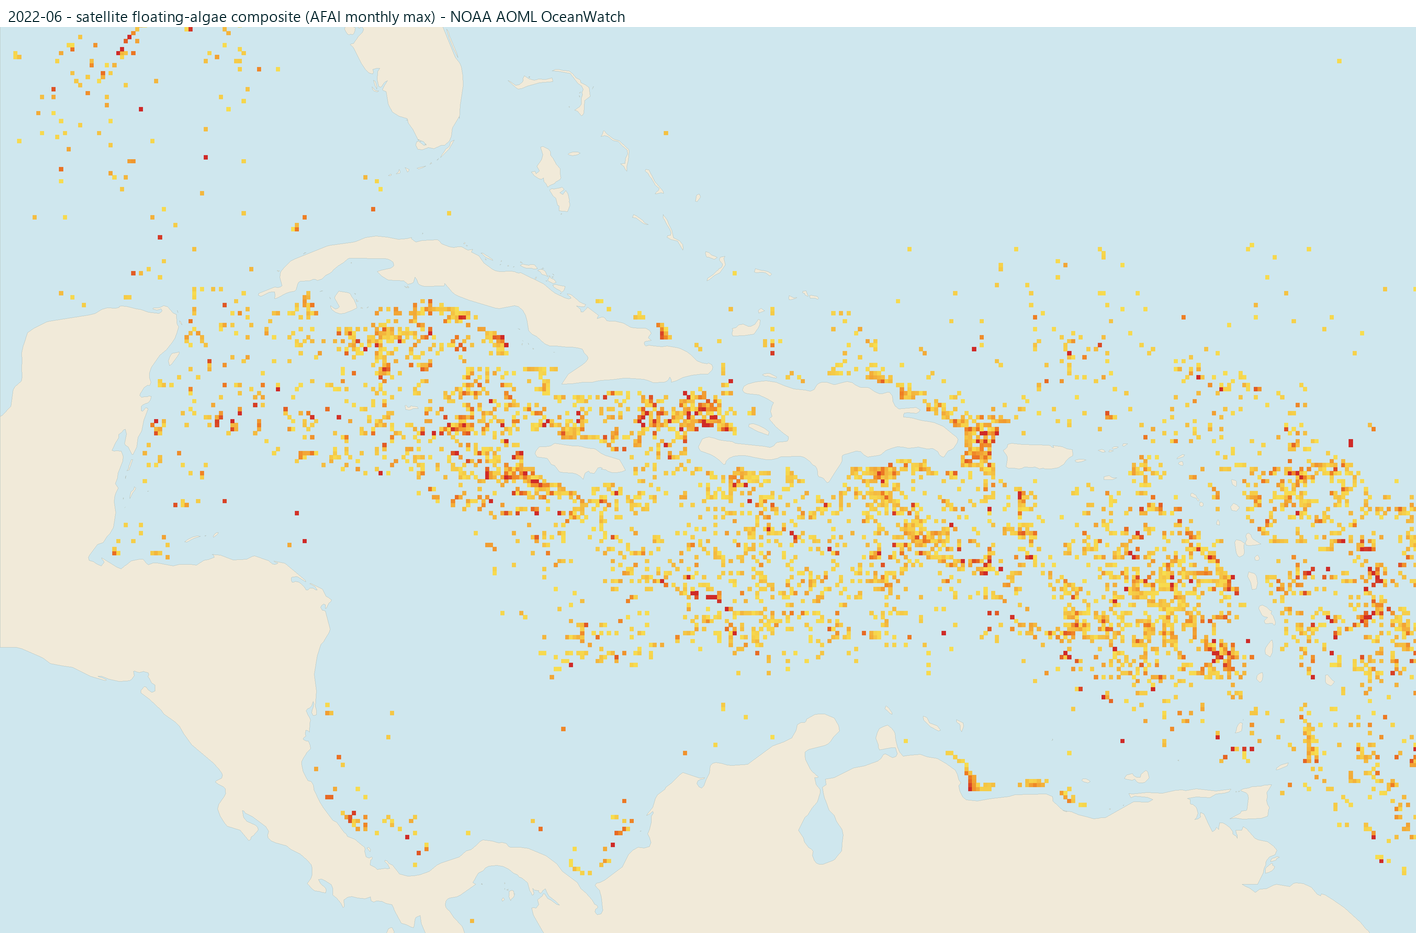
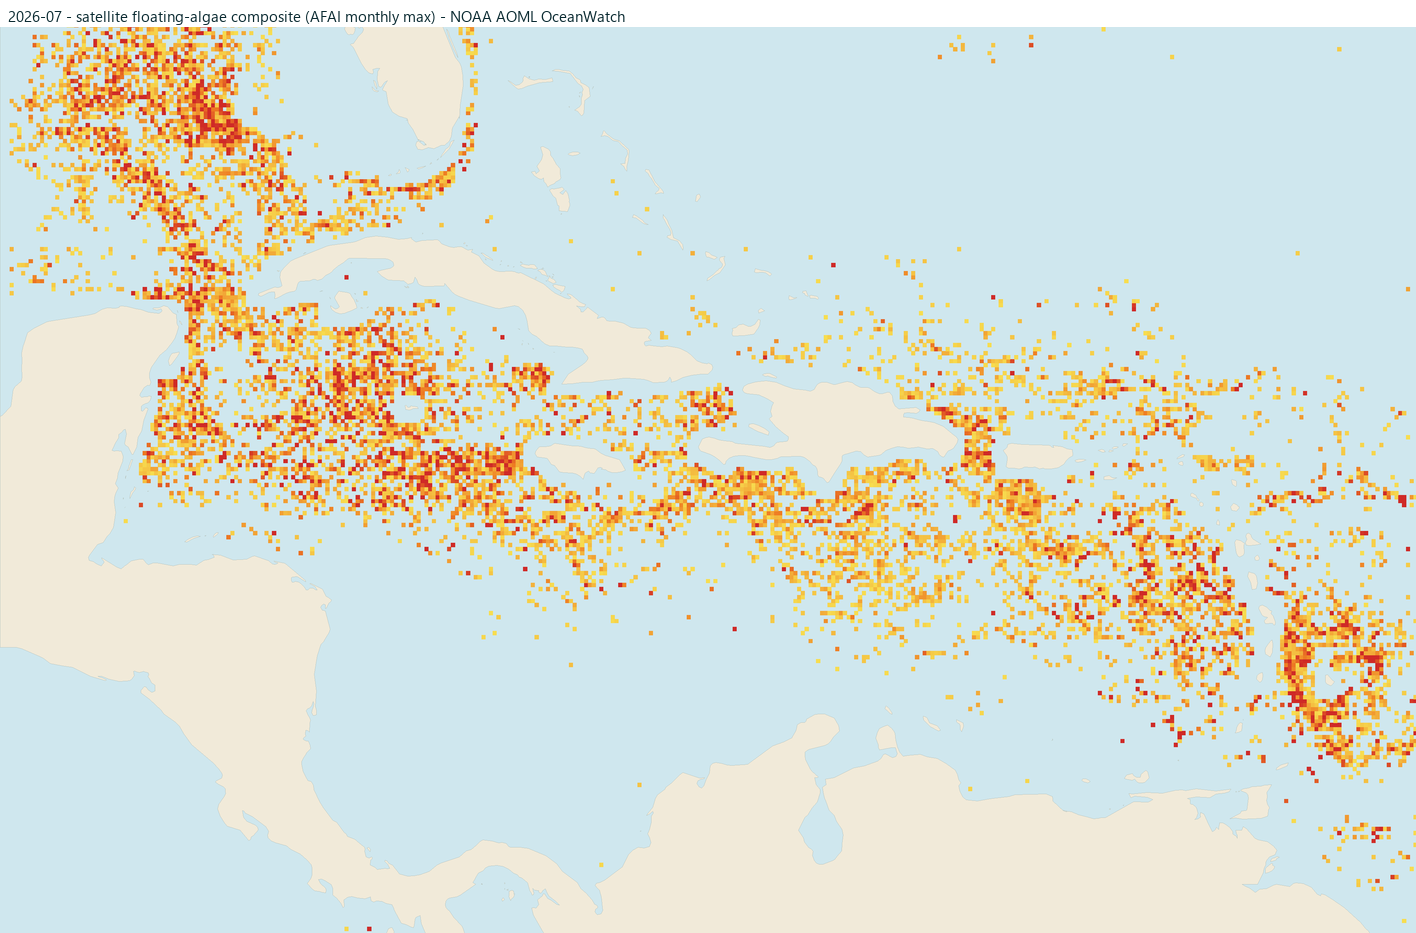
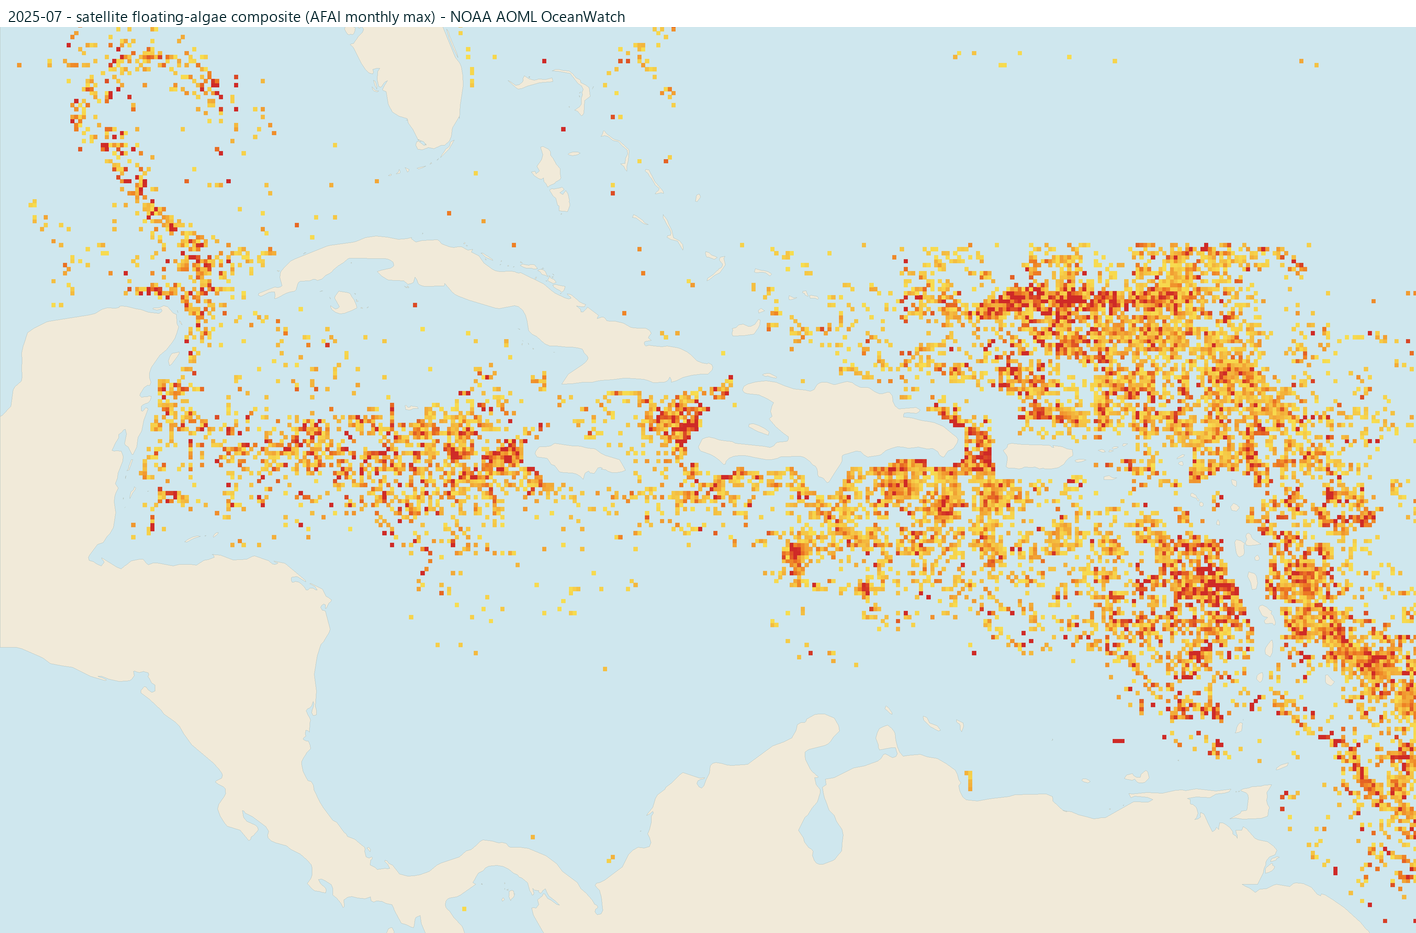
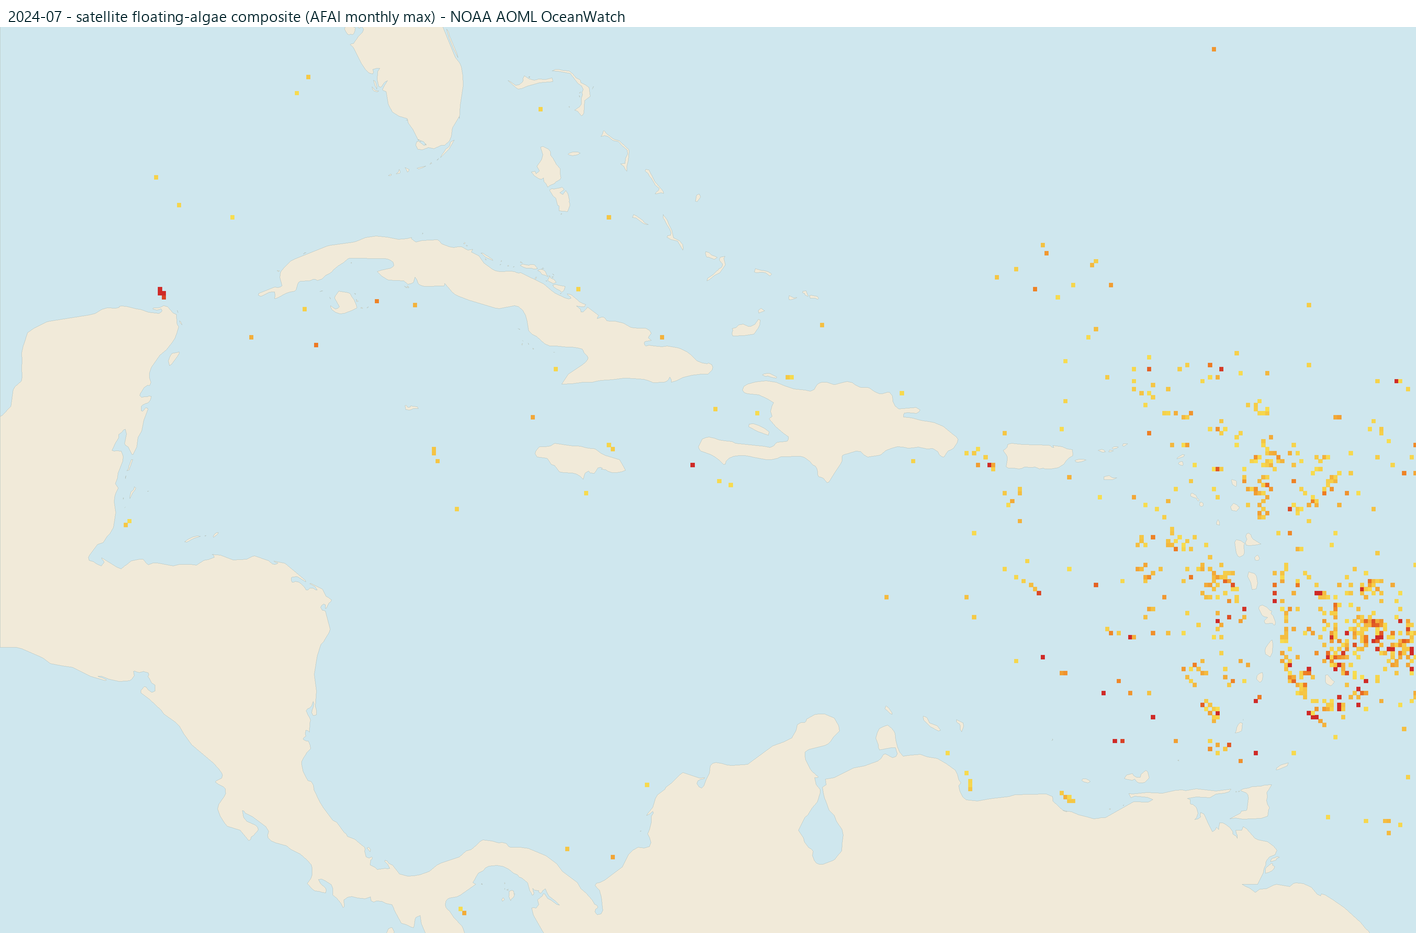
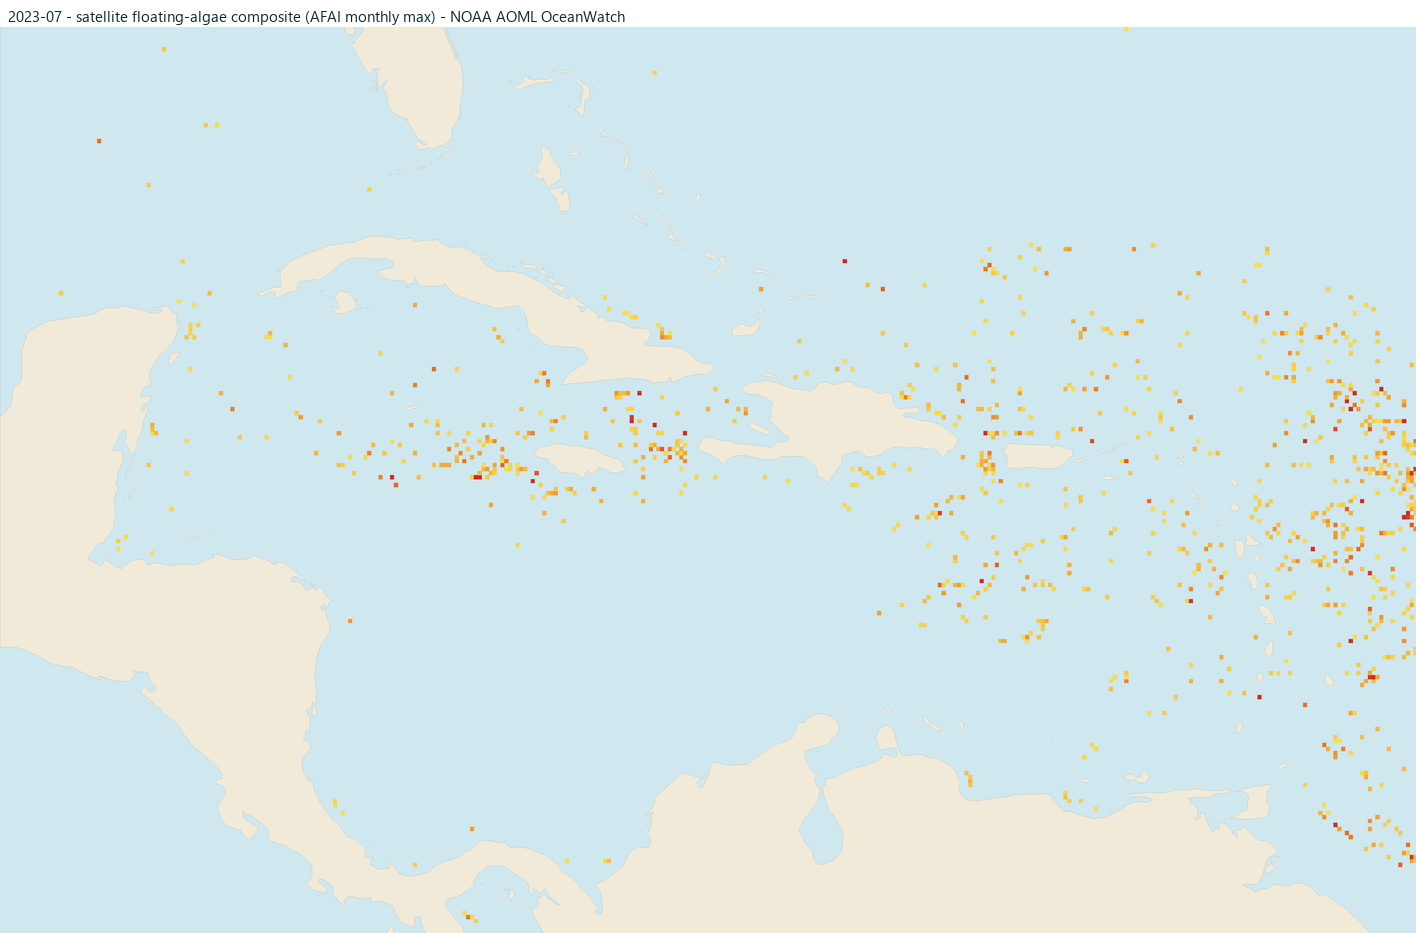
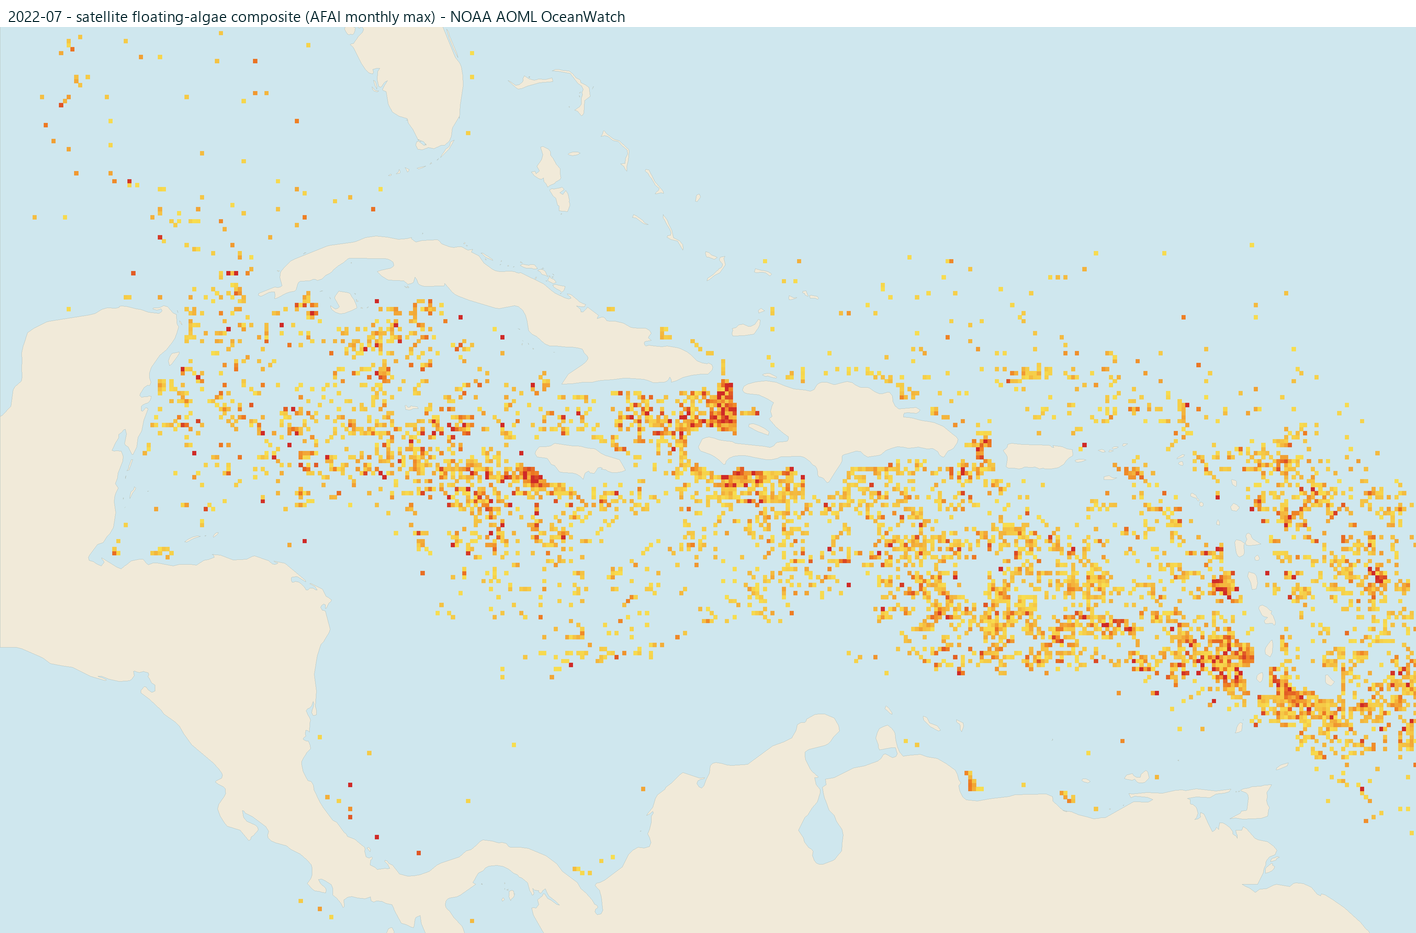
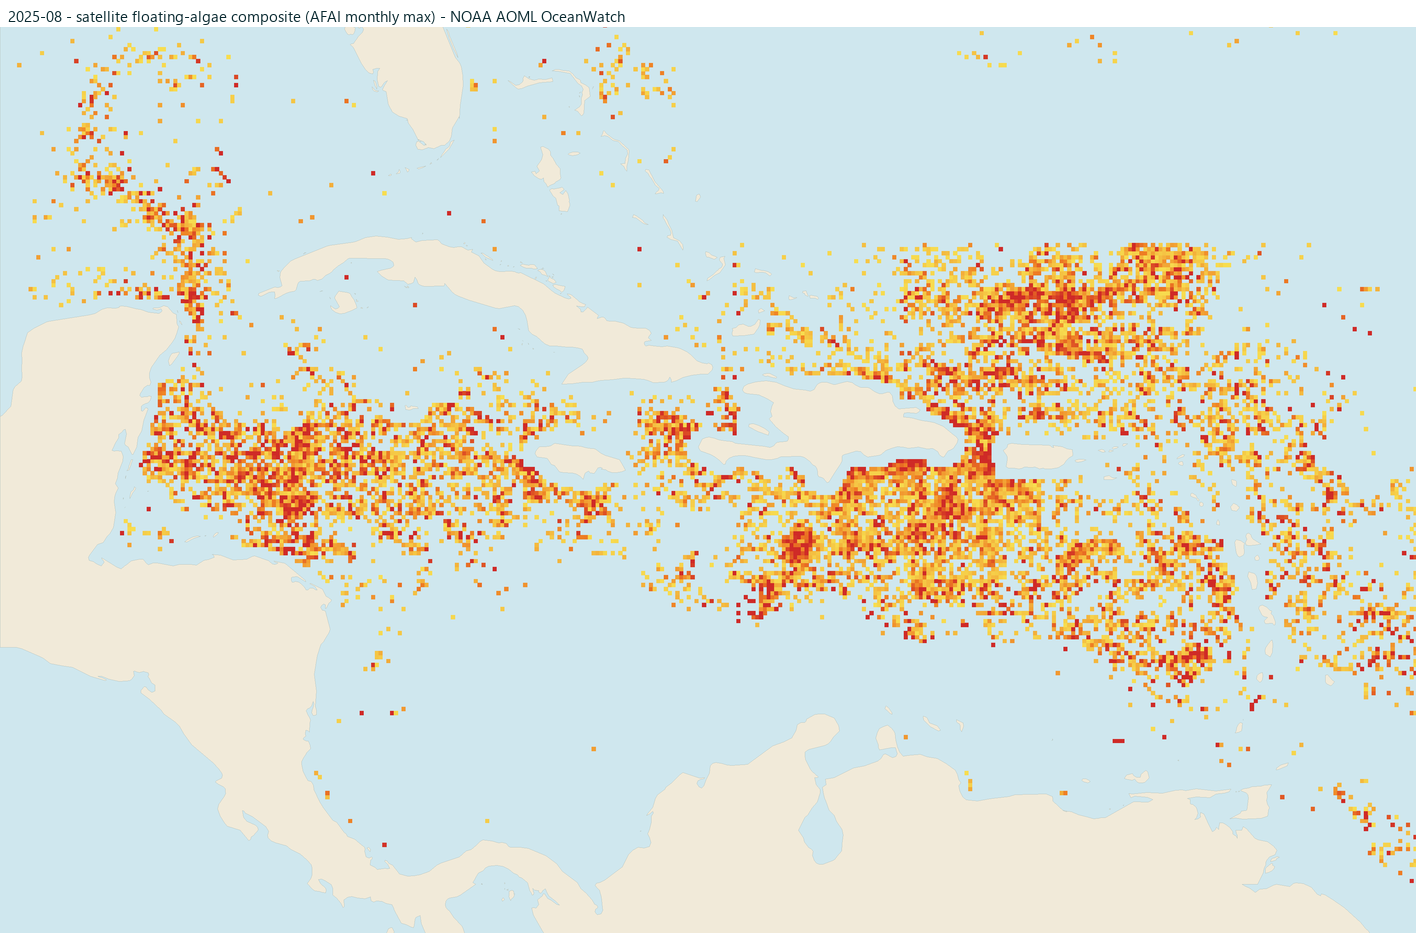
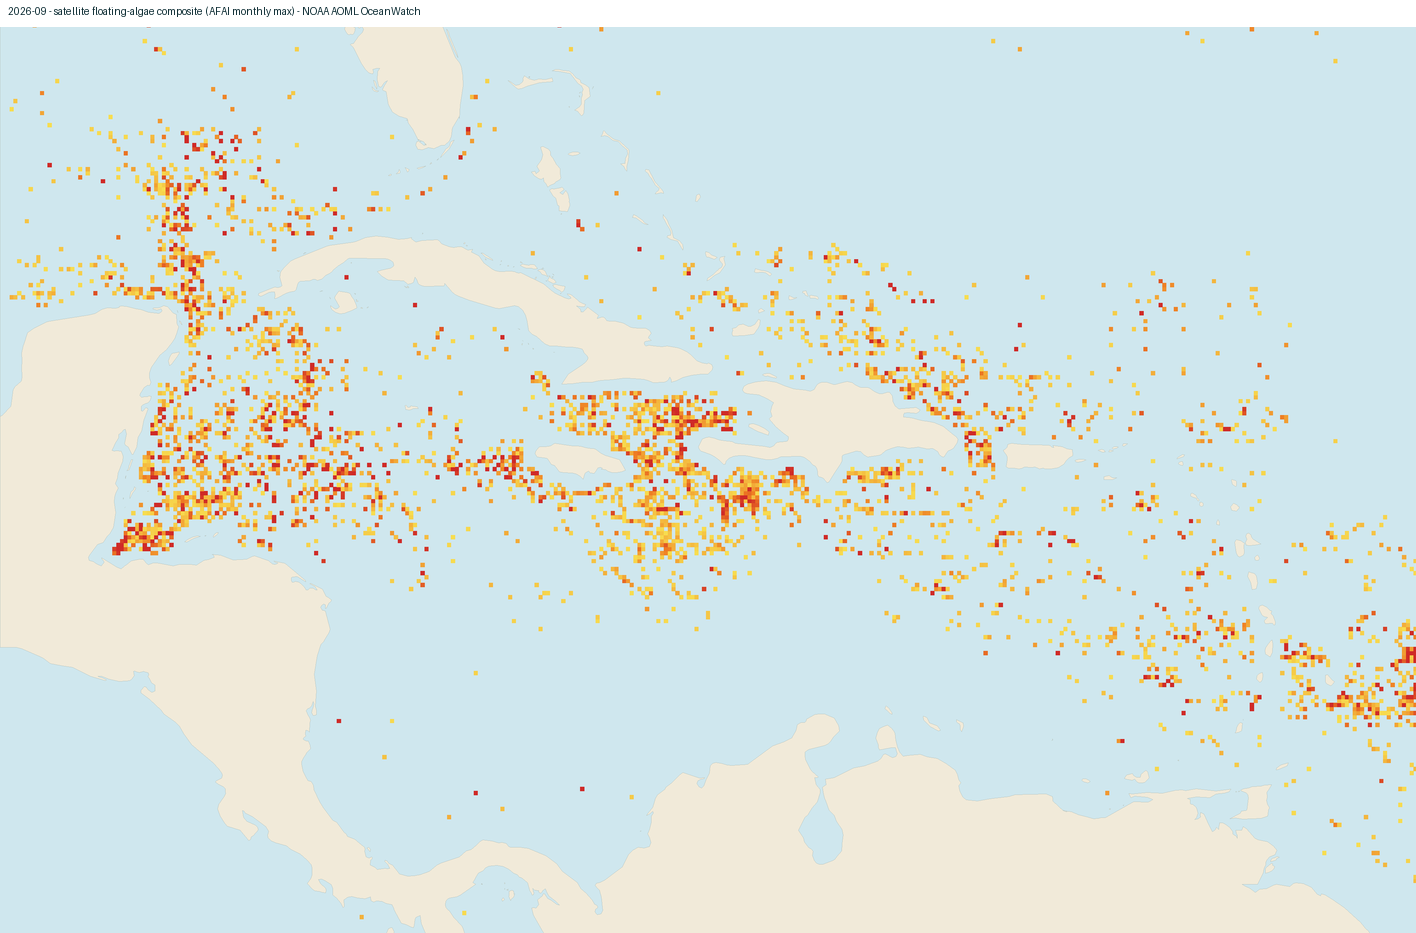
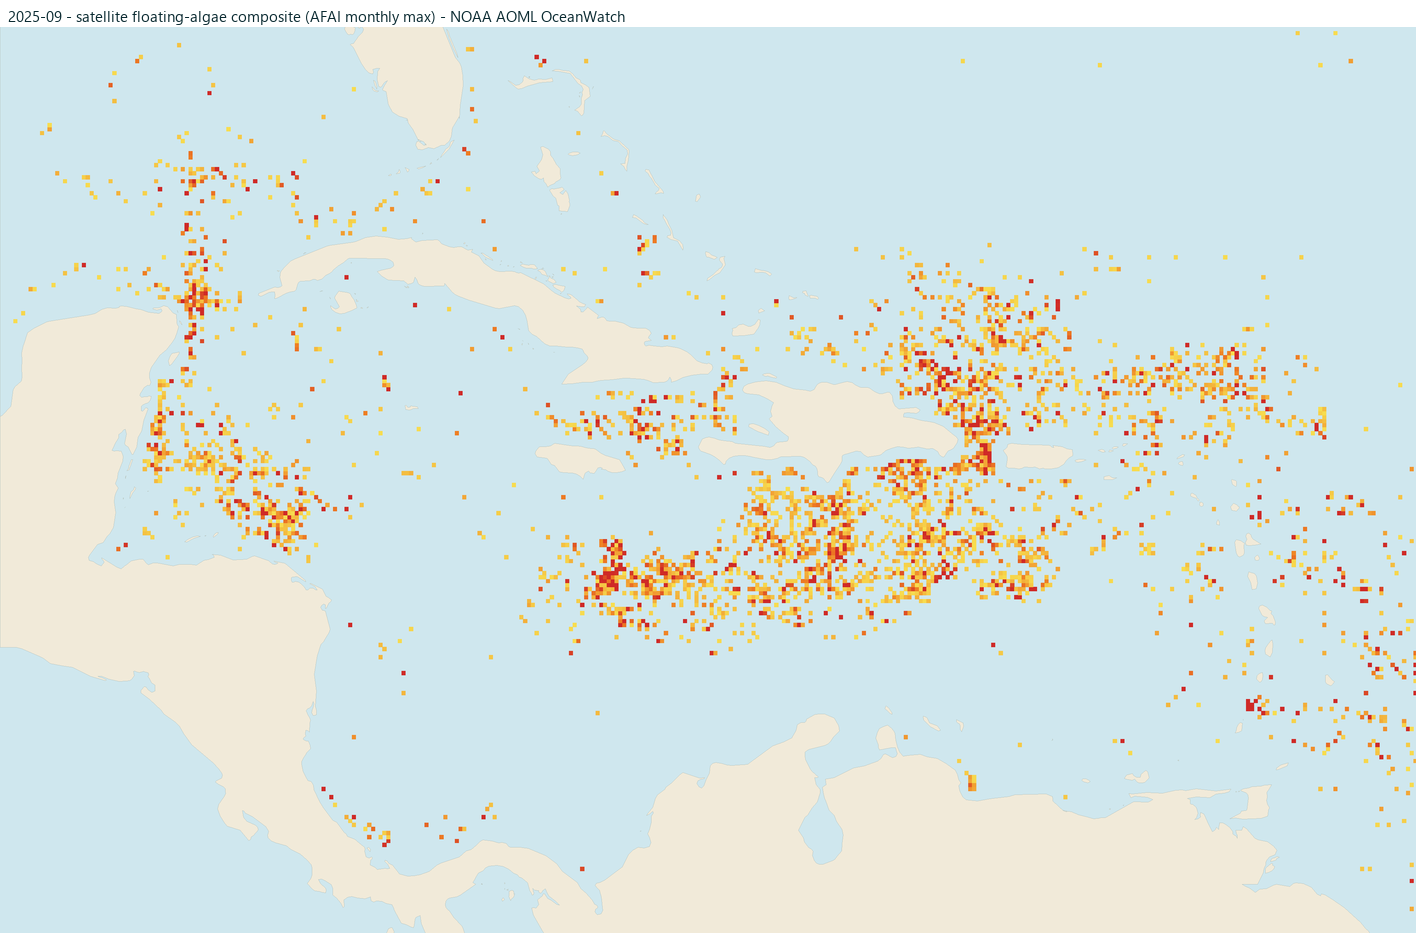
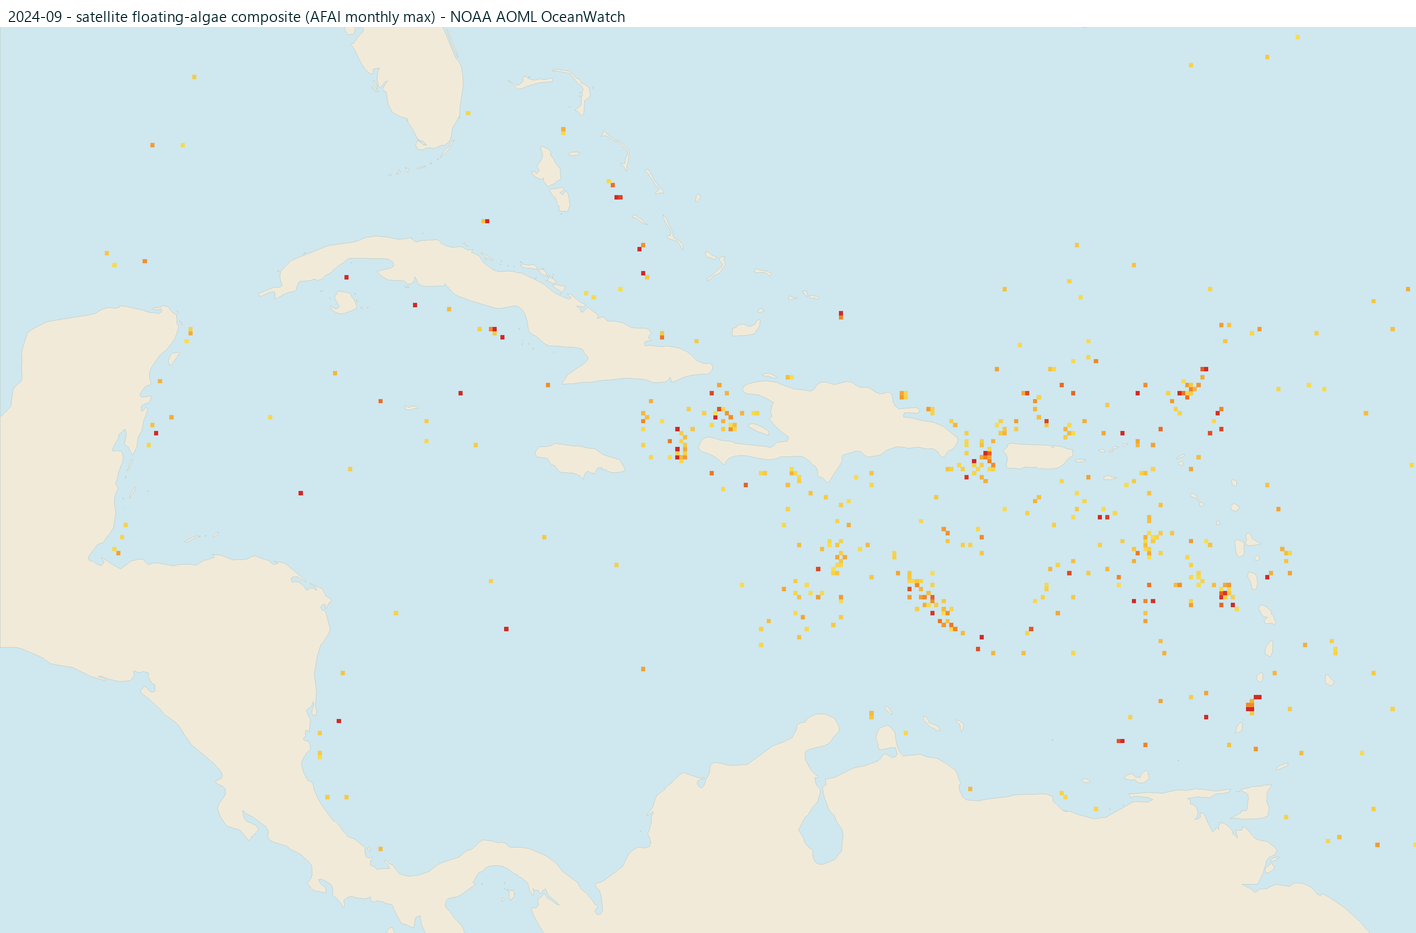
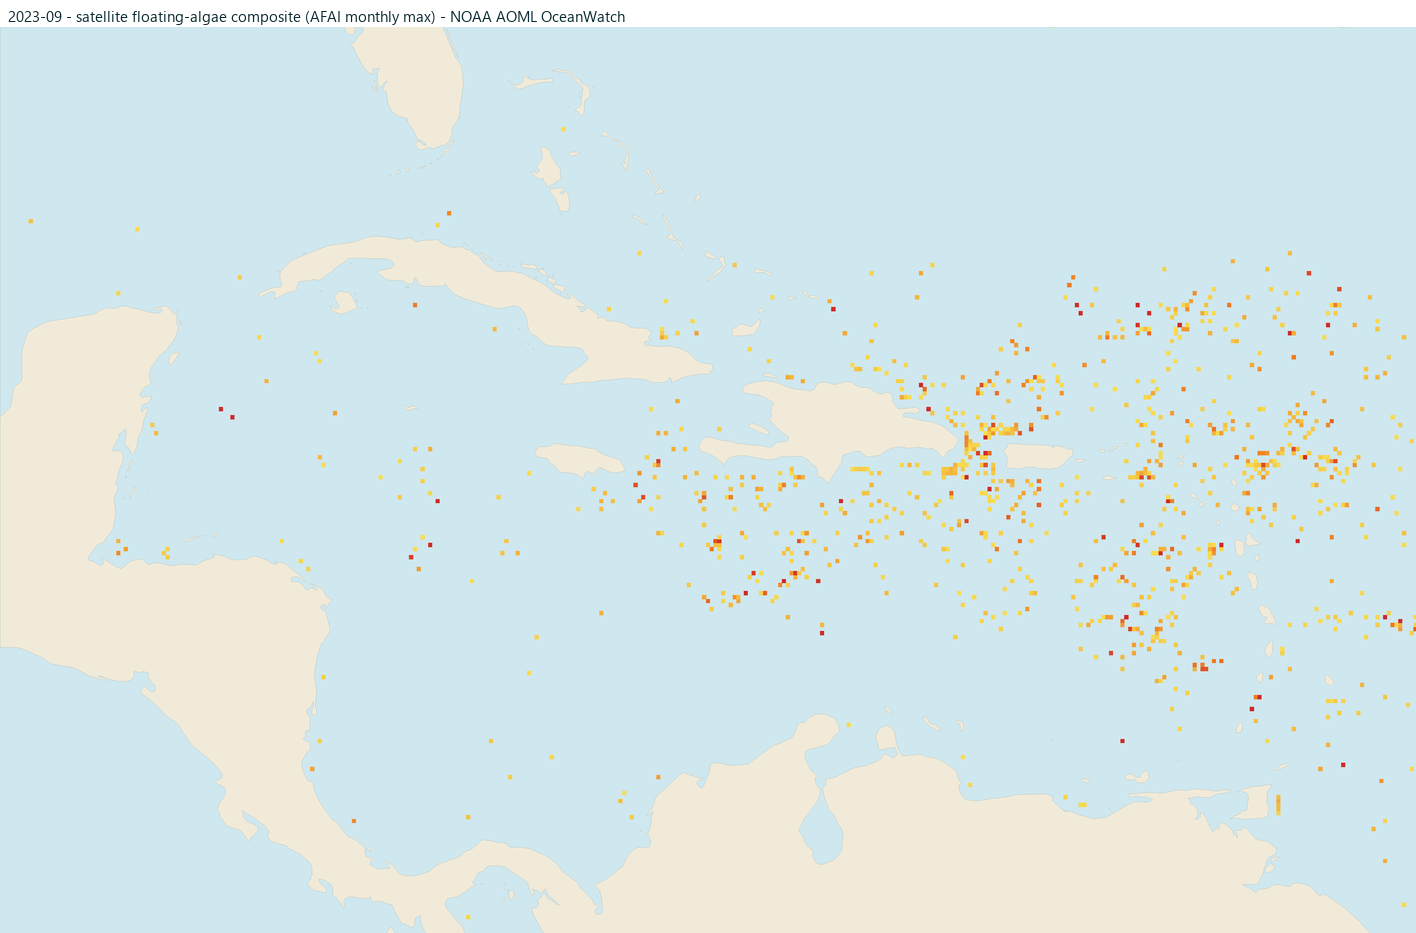
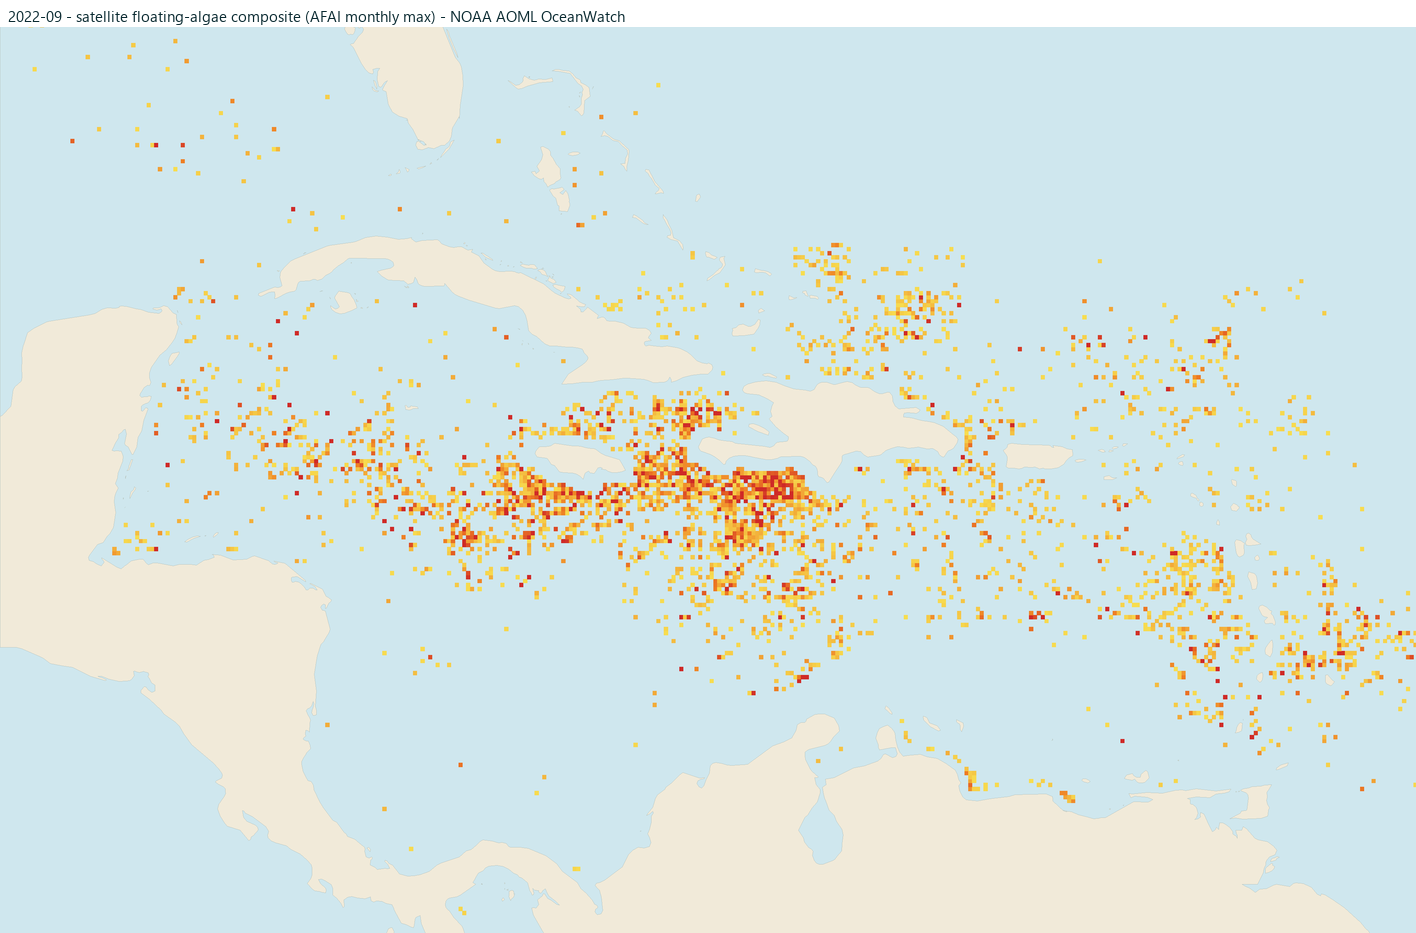
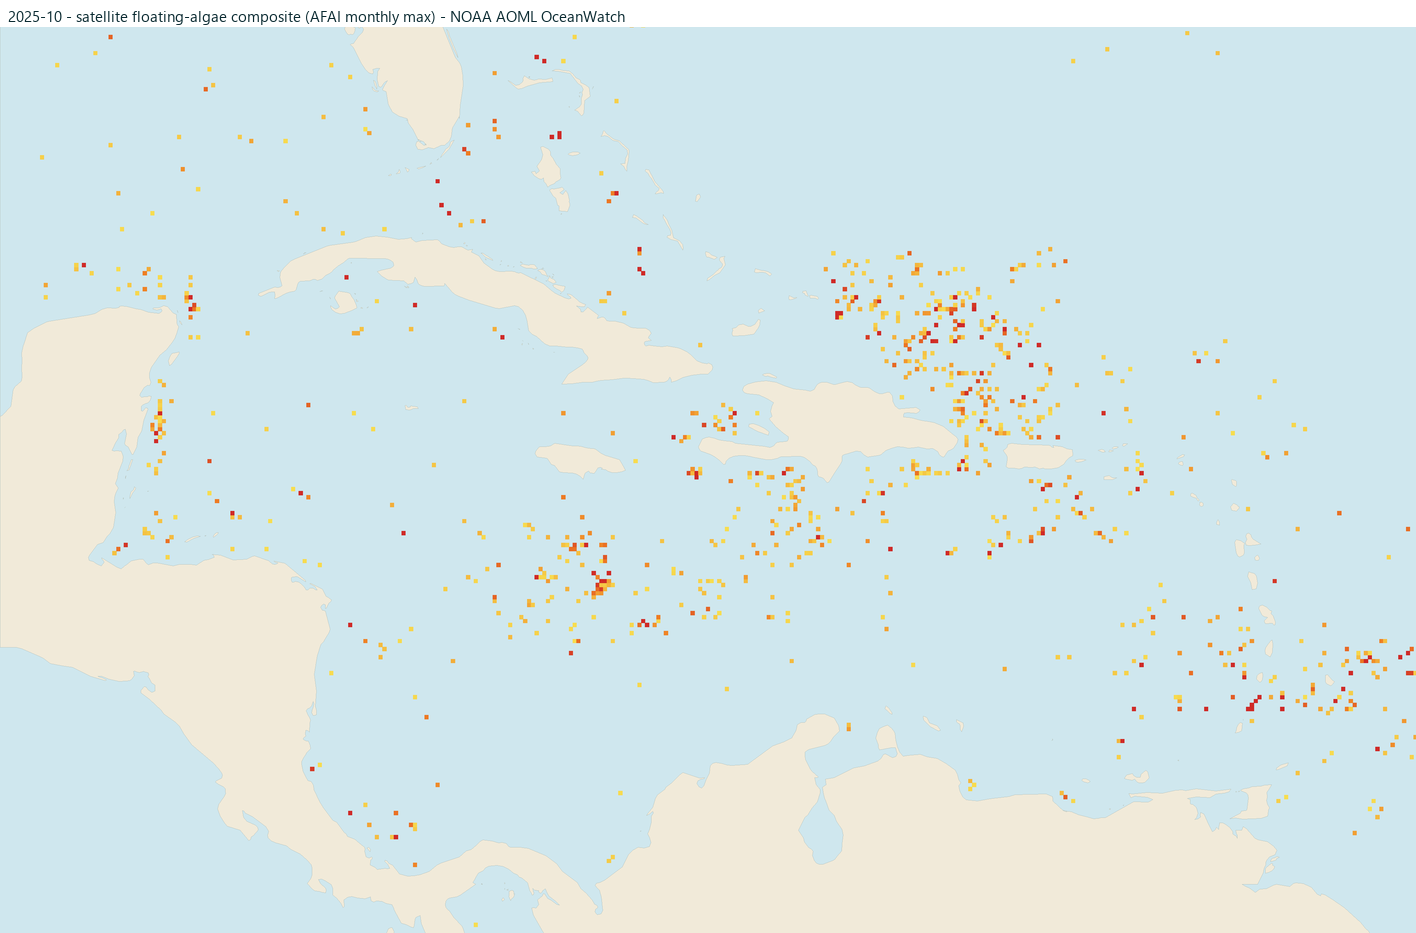
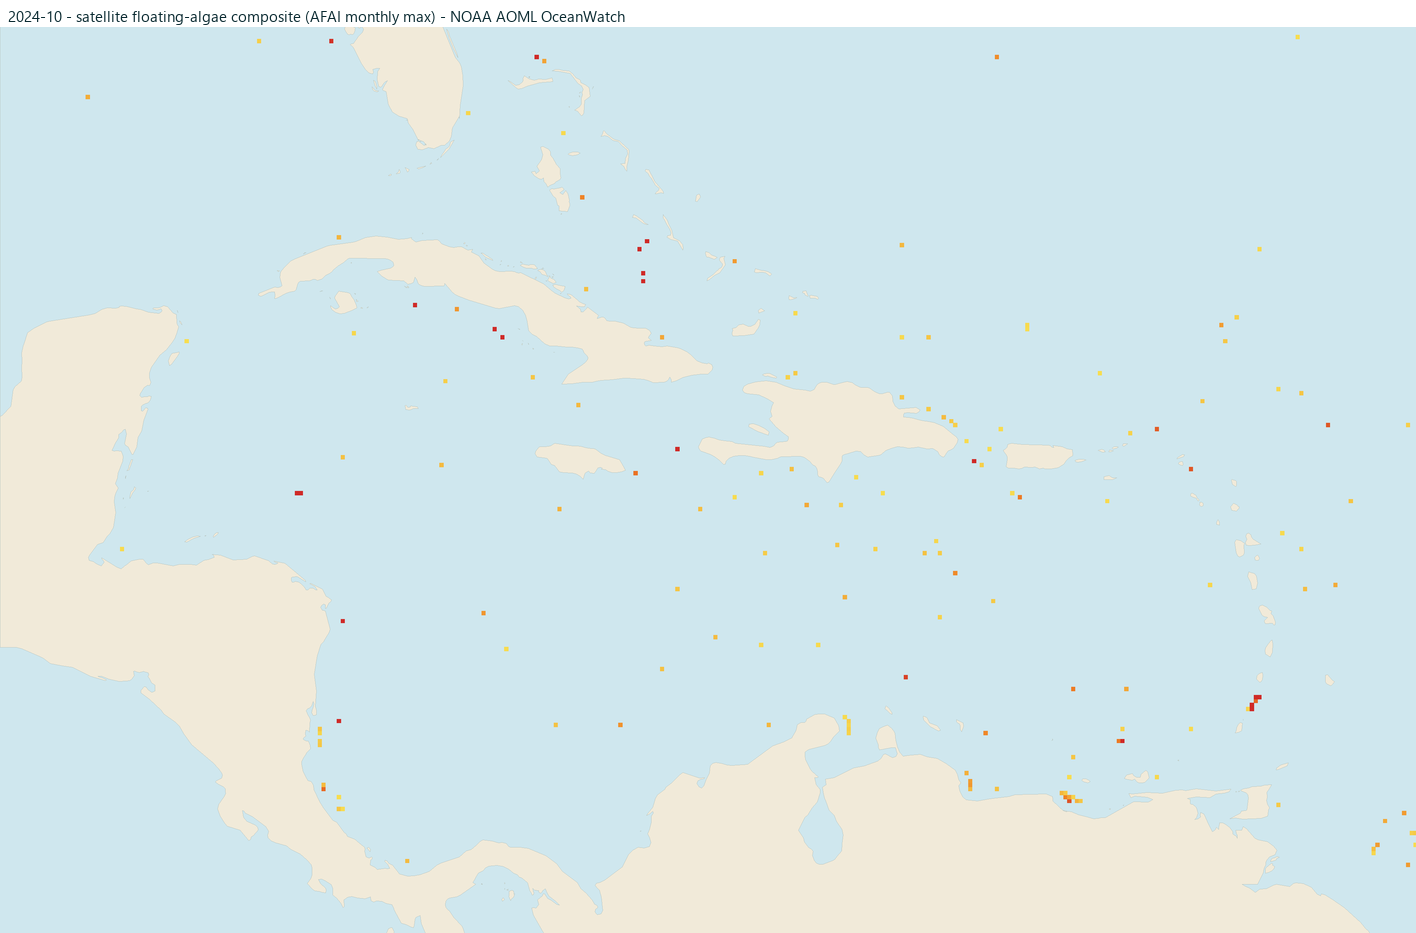
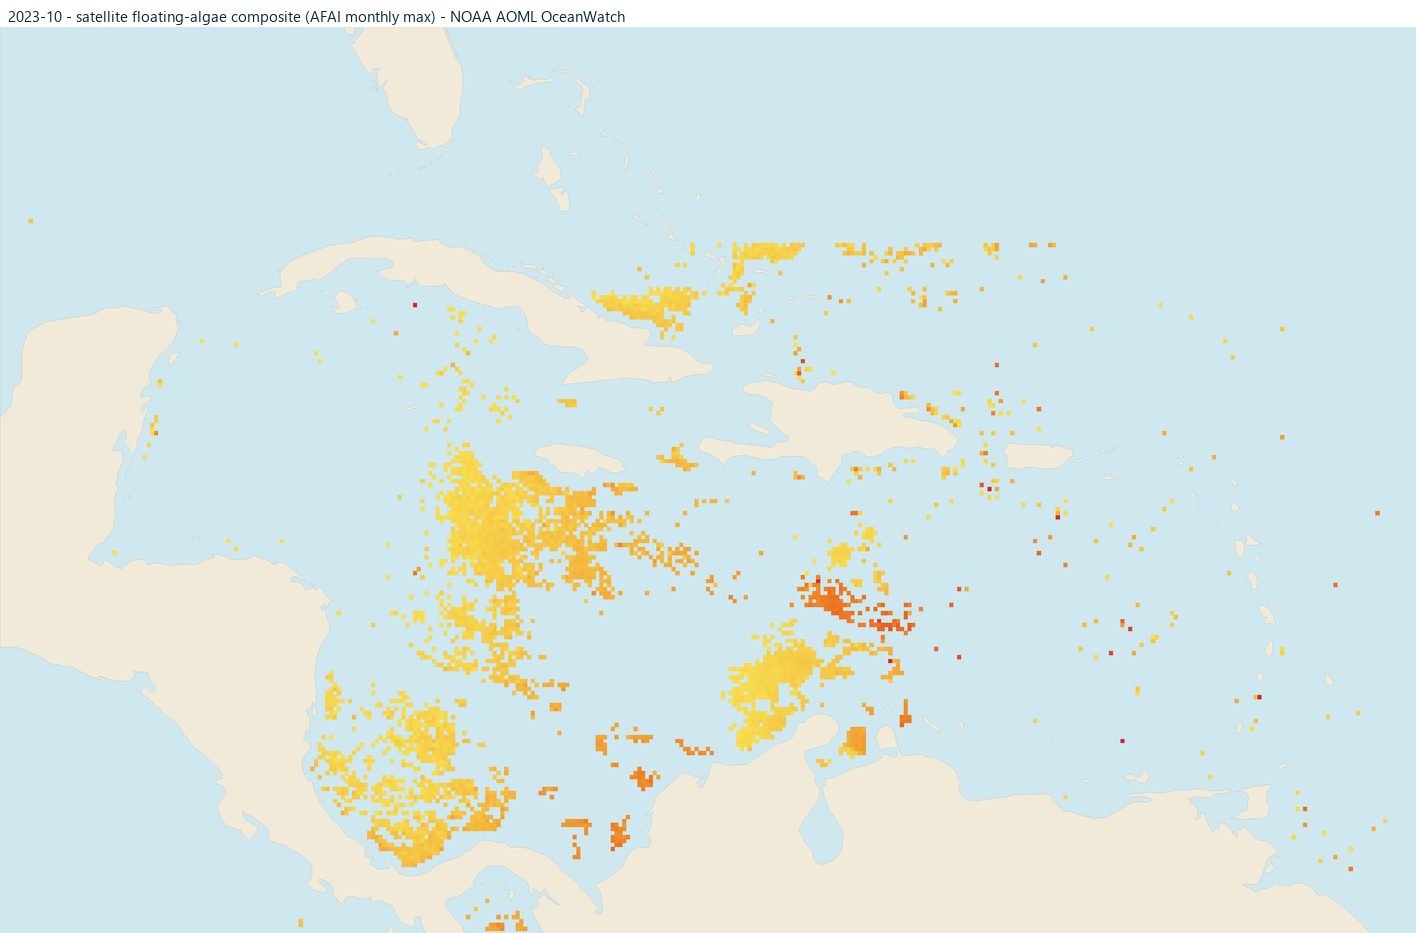
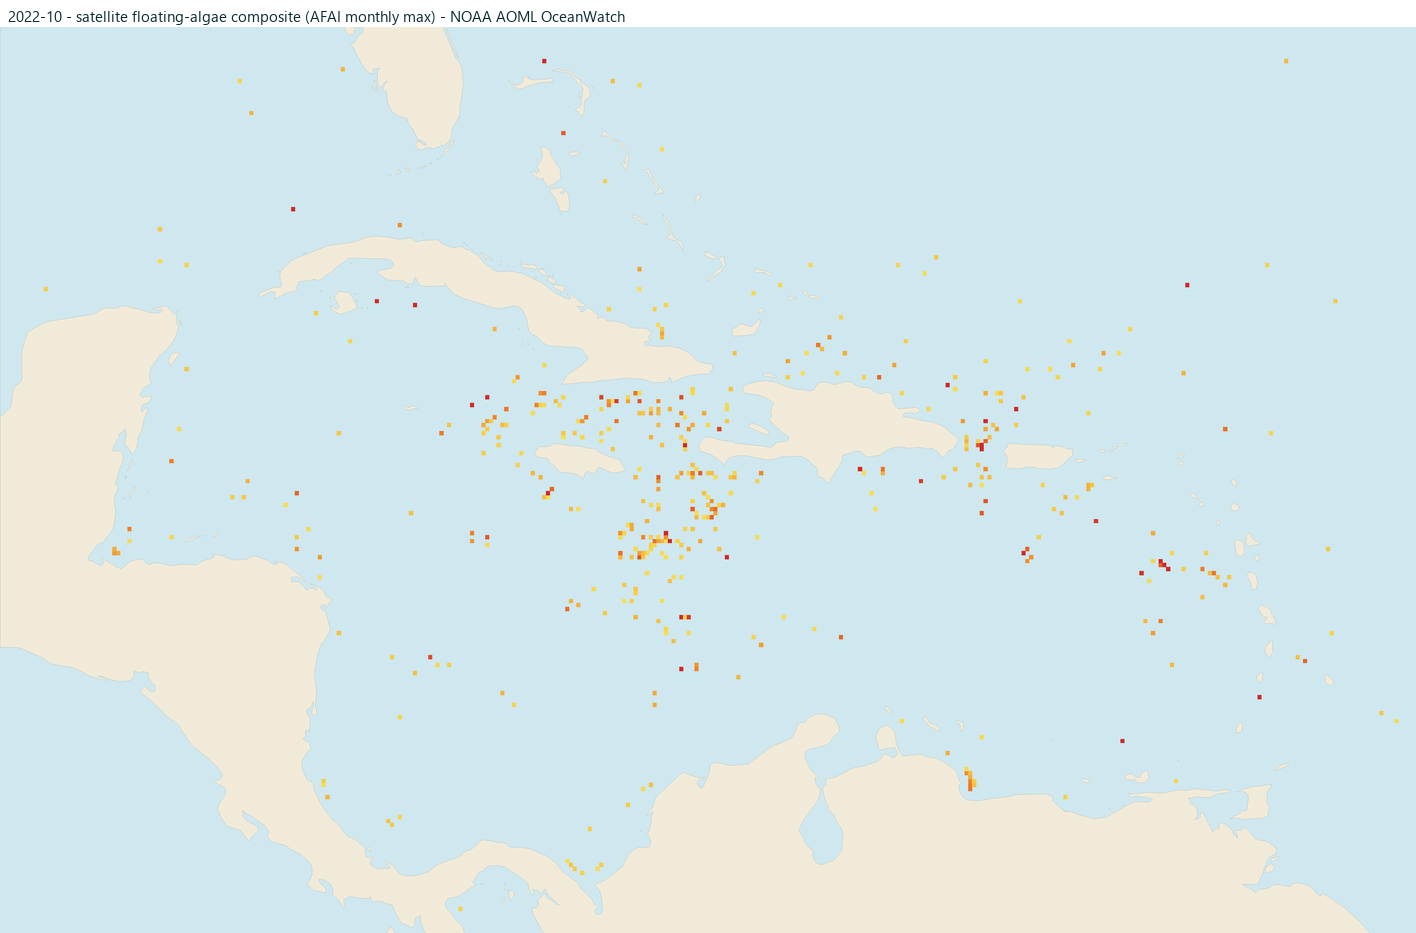
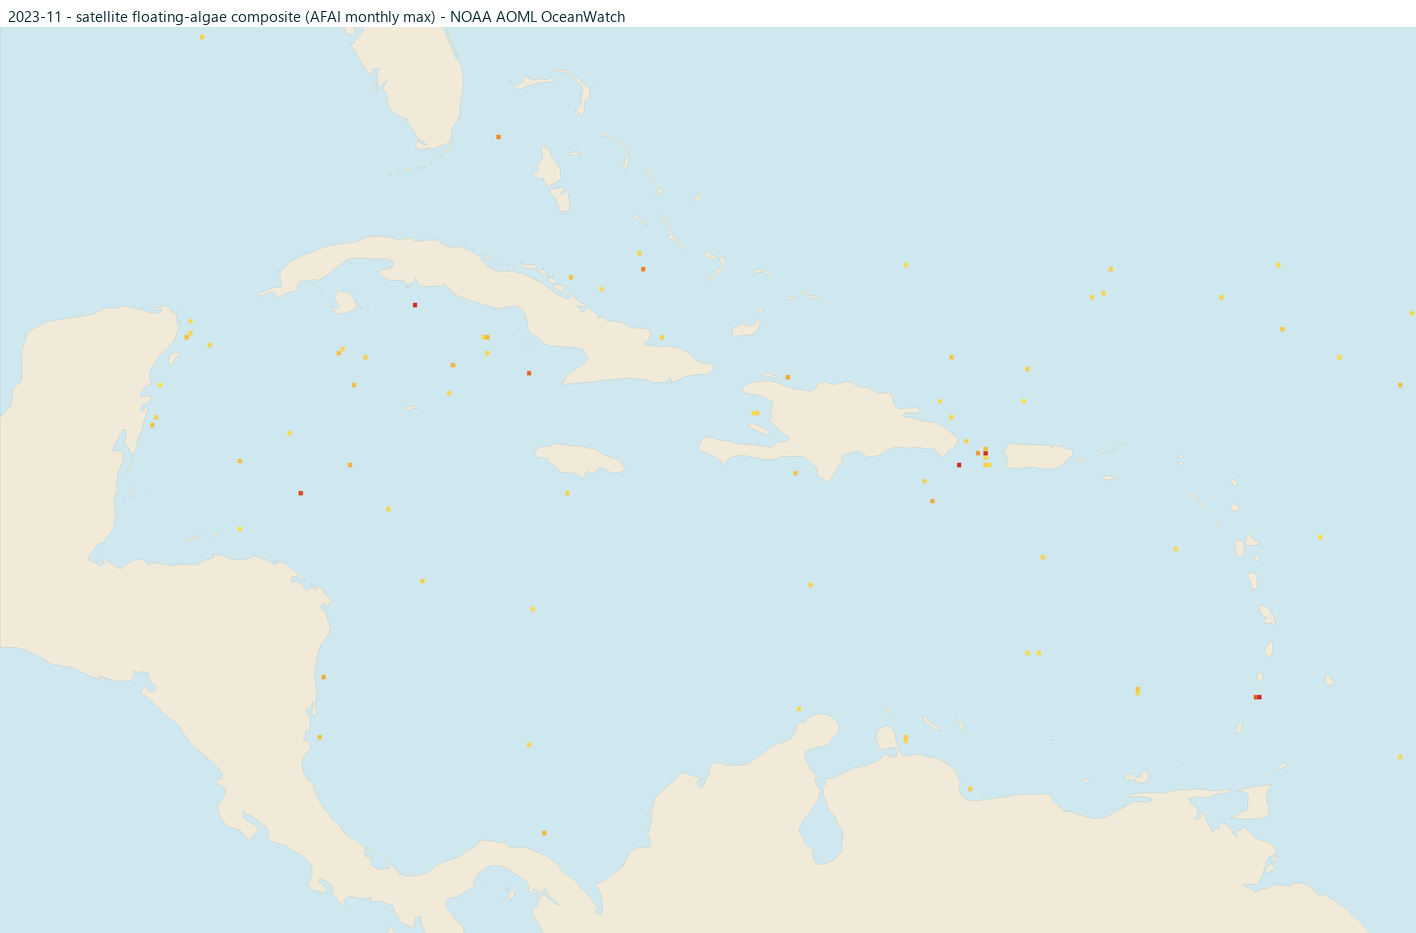
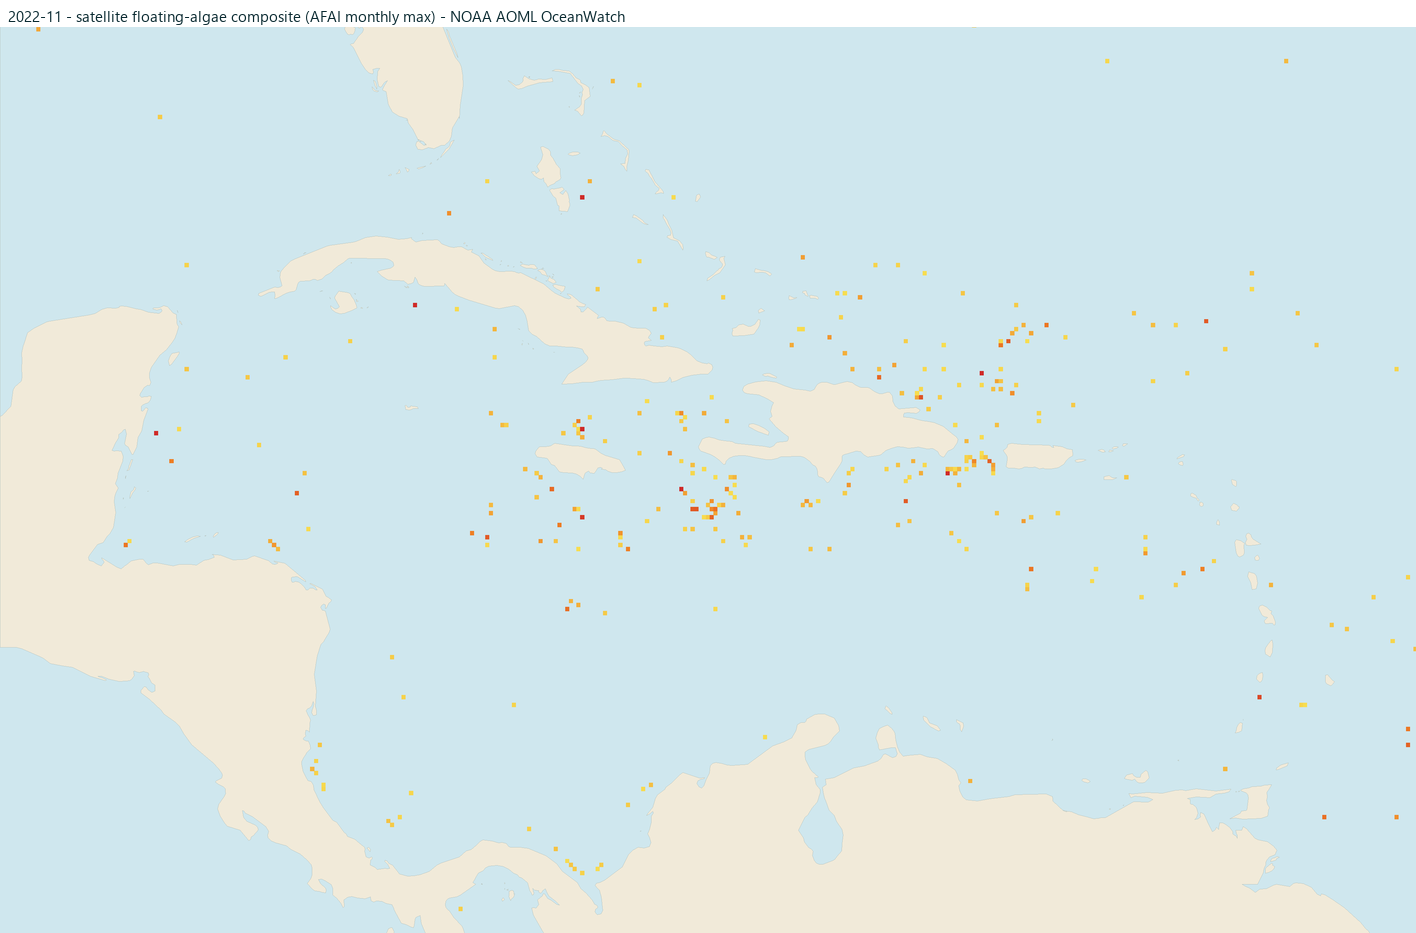
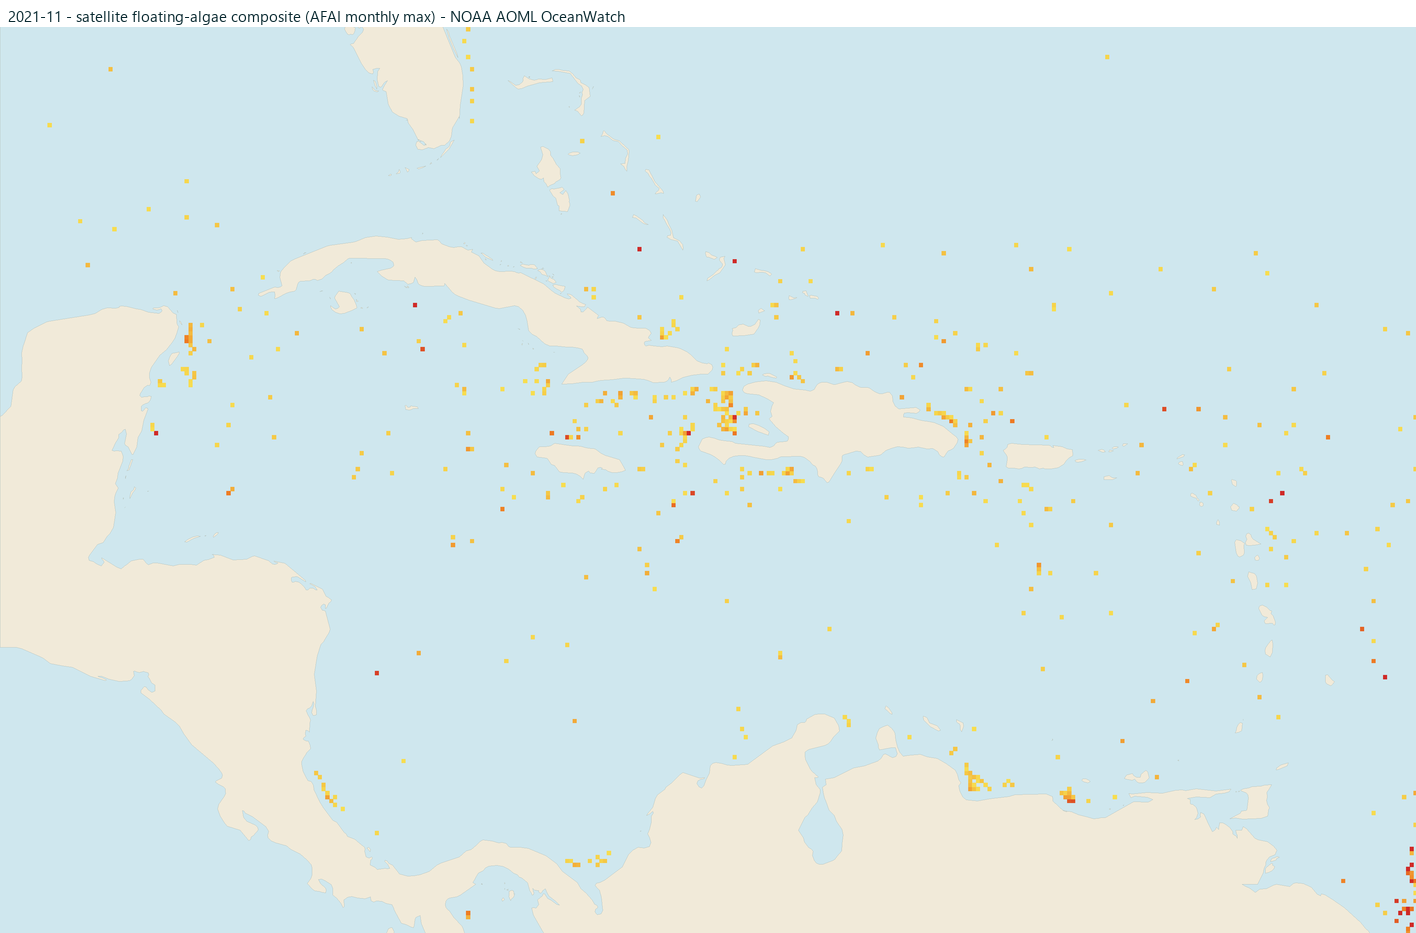
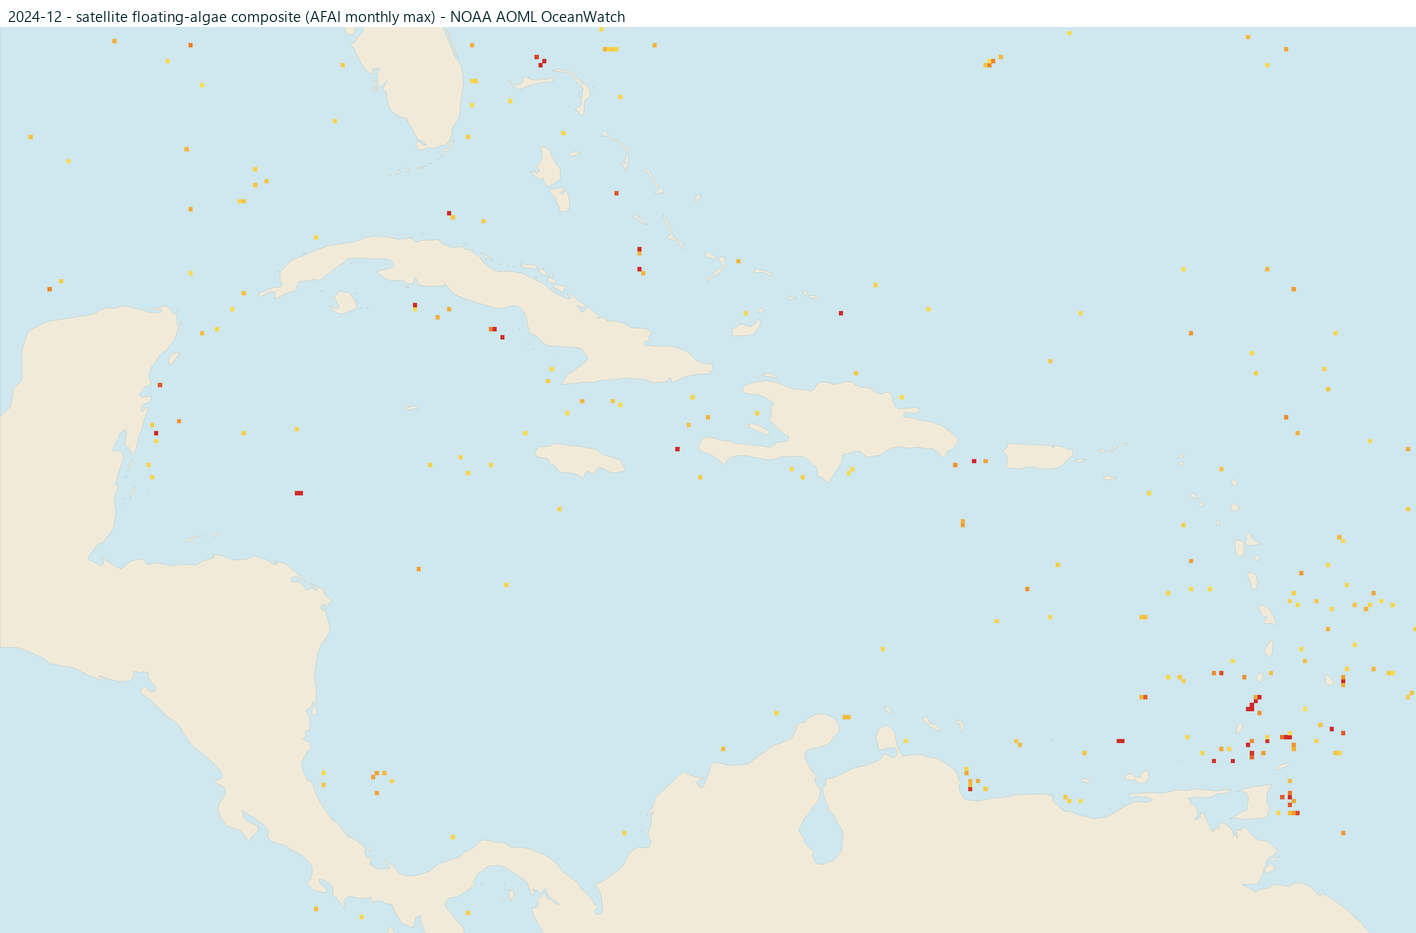
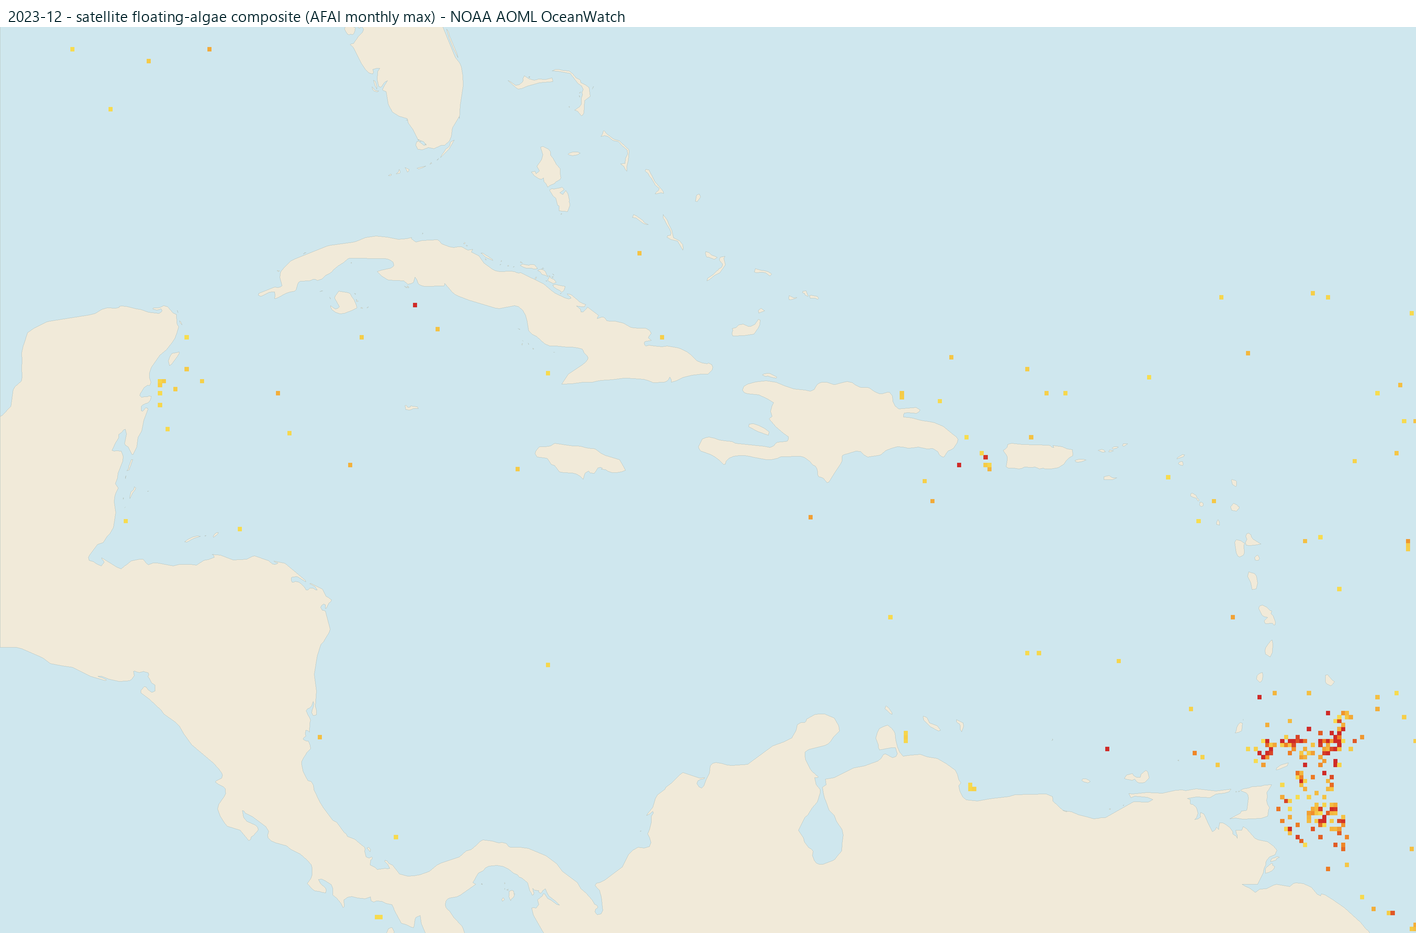
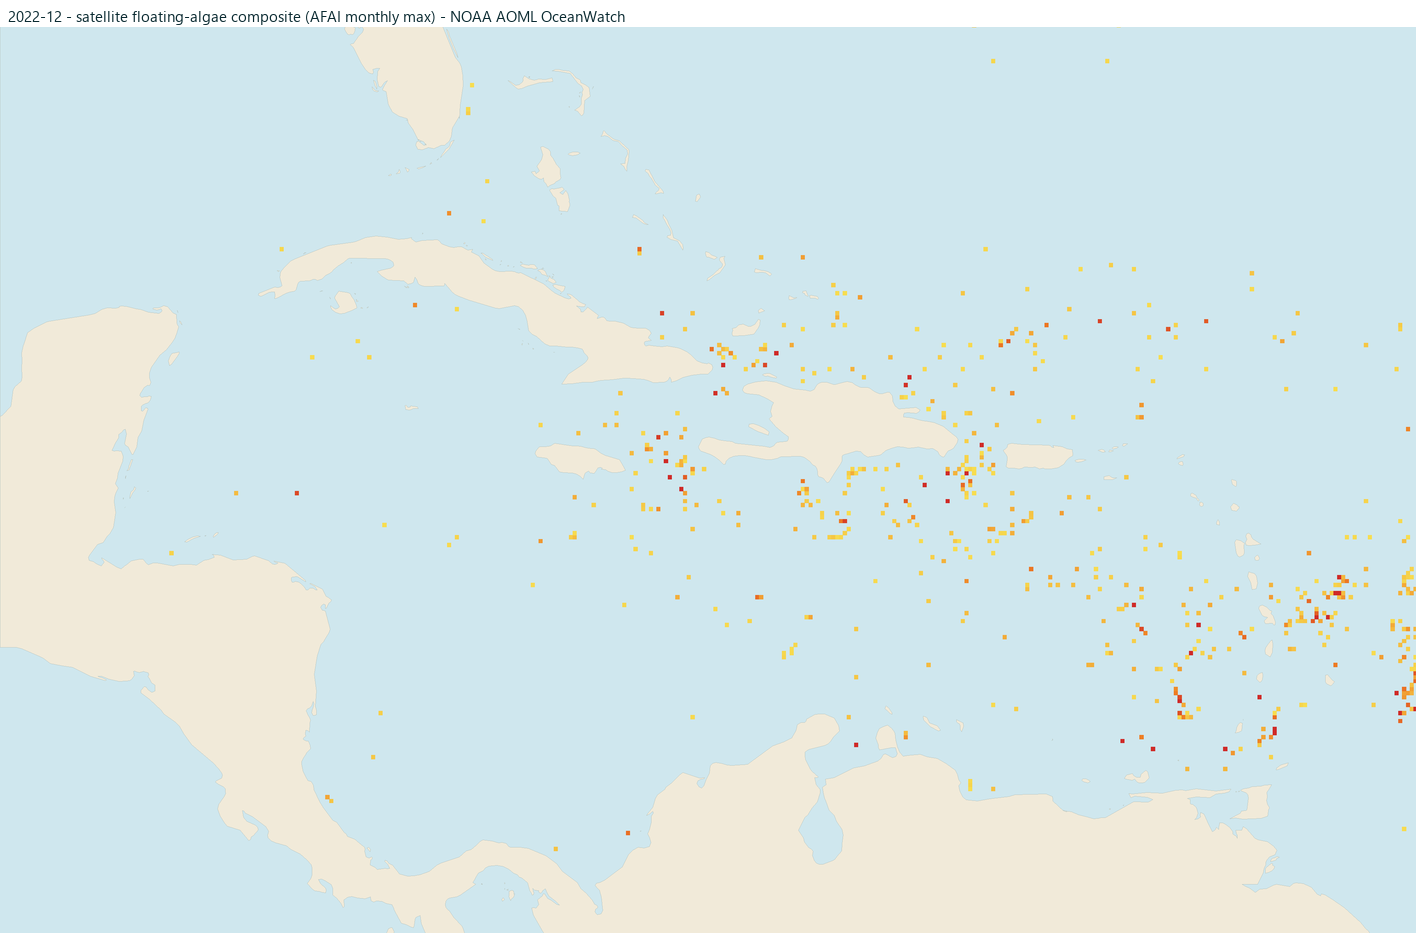
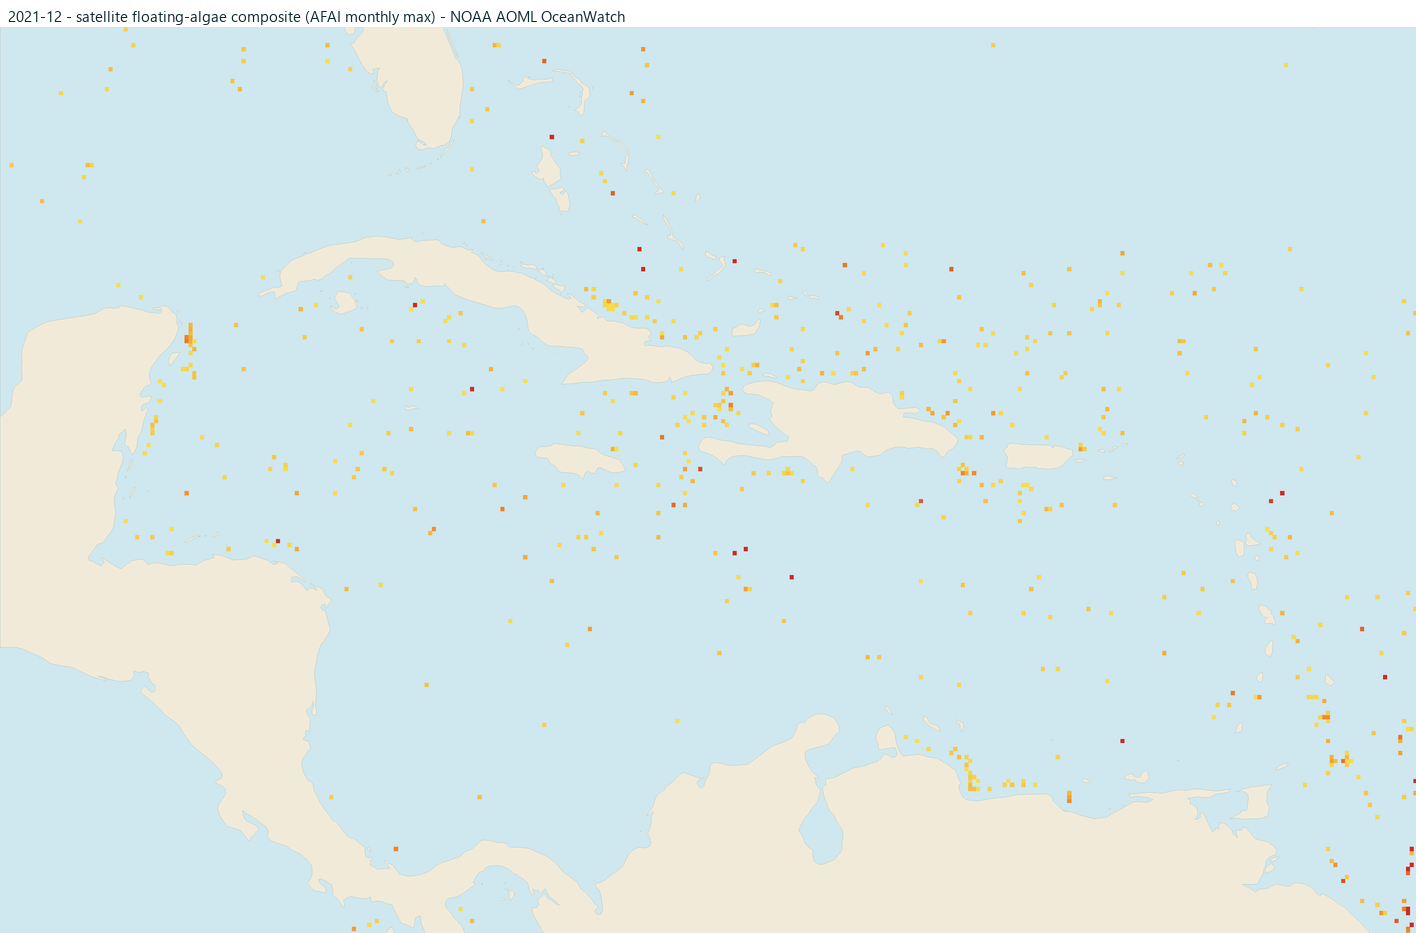
On today's map
See for yourself
A camera shows one beach at one moment, so it cannot clear a whole destination. But it catches the thing no satellite can: what the sand and water look like right now.
Verified privacy-enhanced embed
Loading contacts YouTube. The fallback link remains available below.
Verified outbound camera link
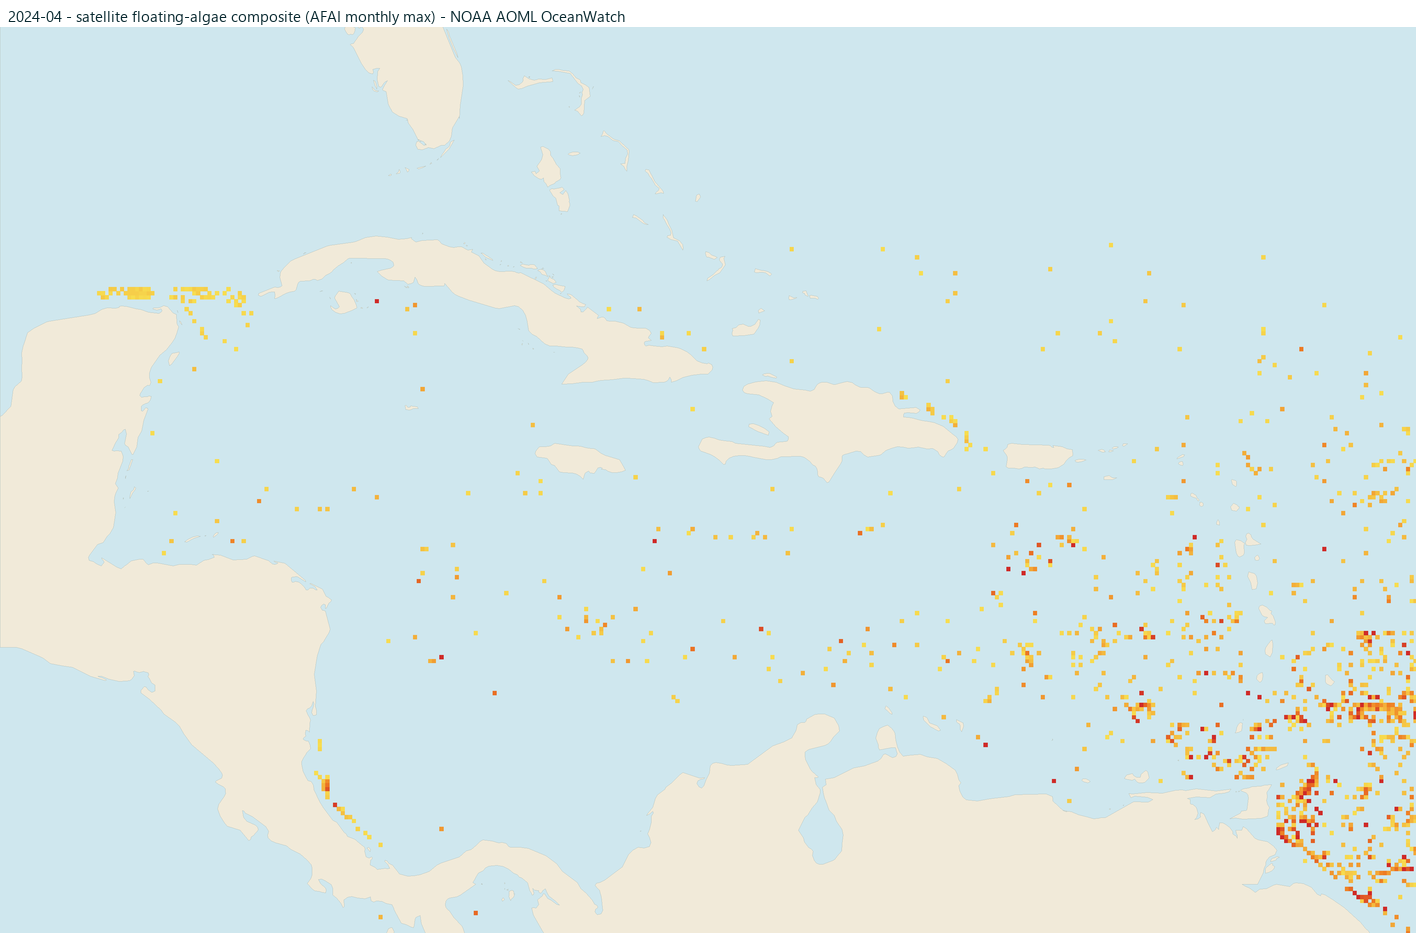
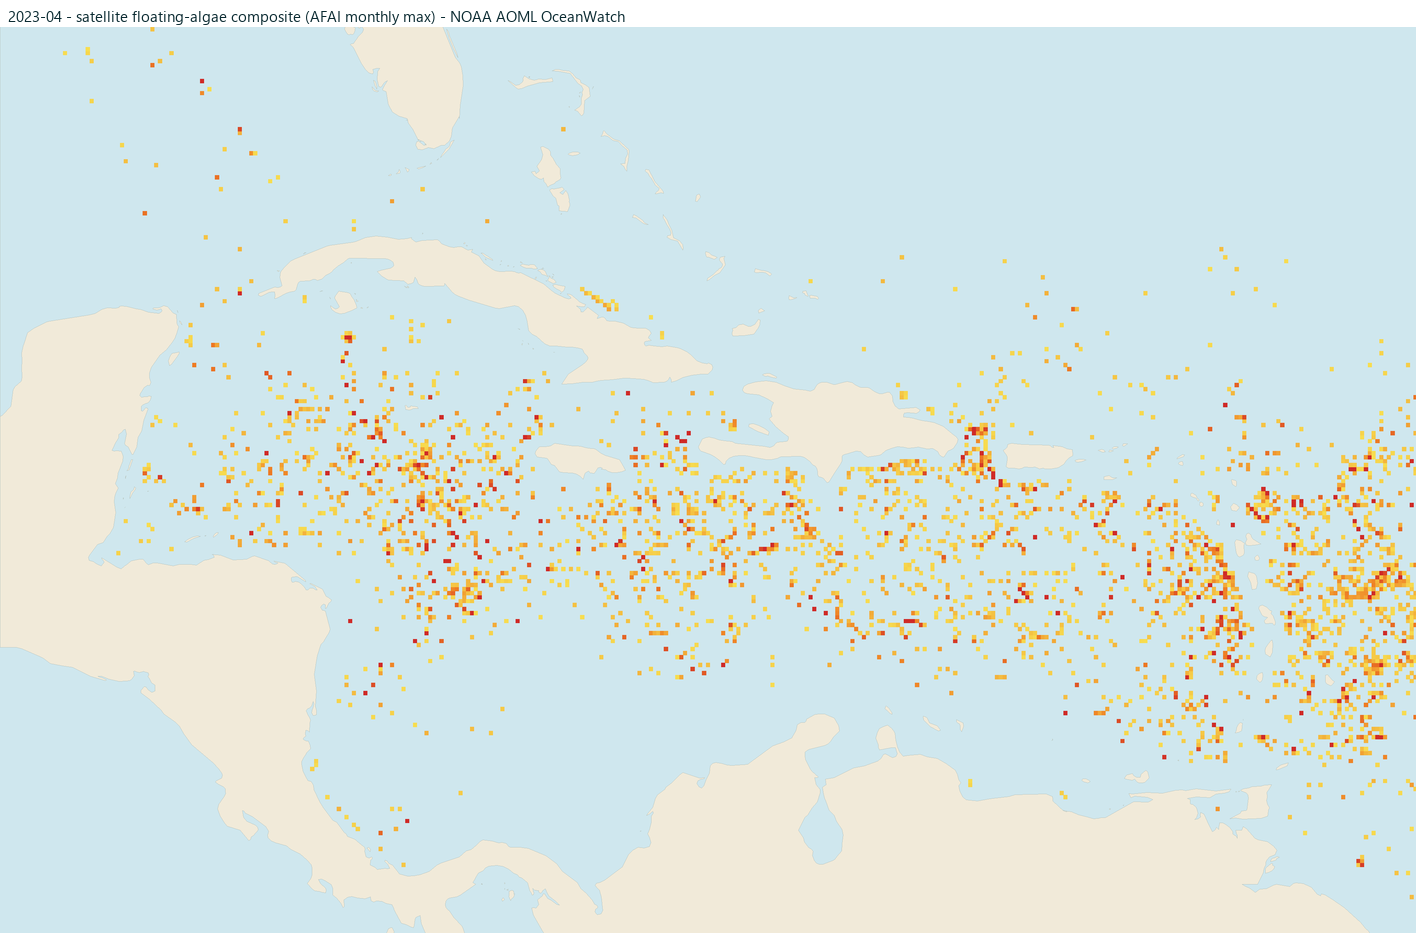
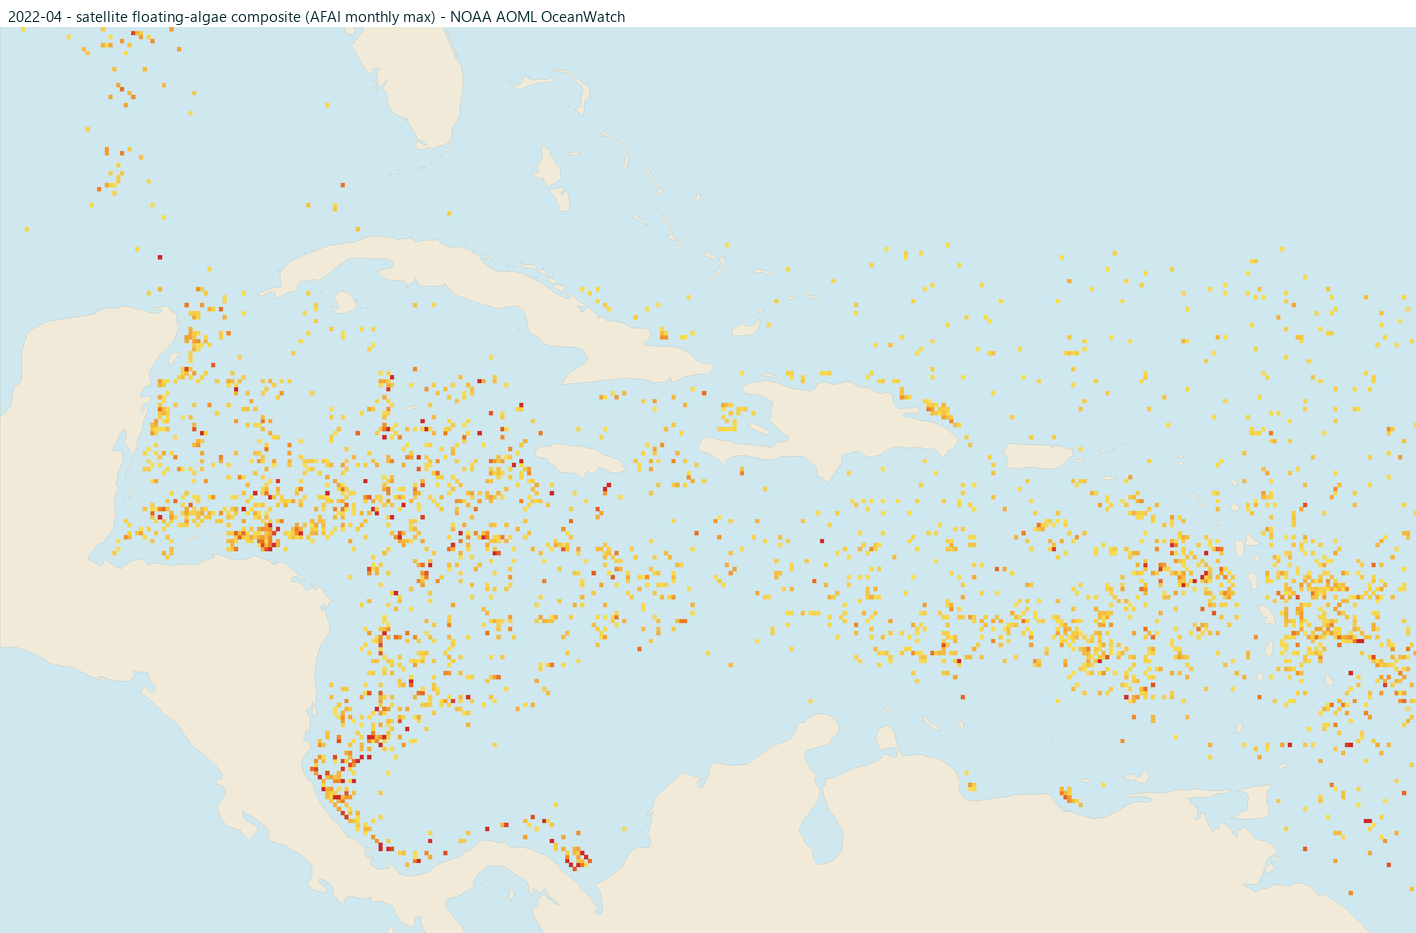
Month by month editorial
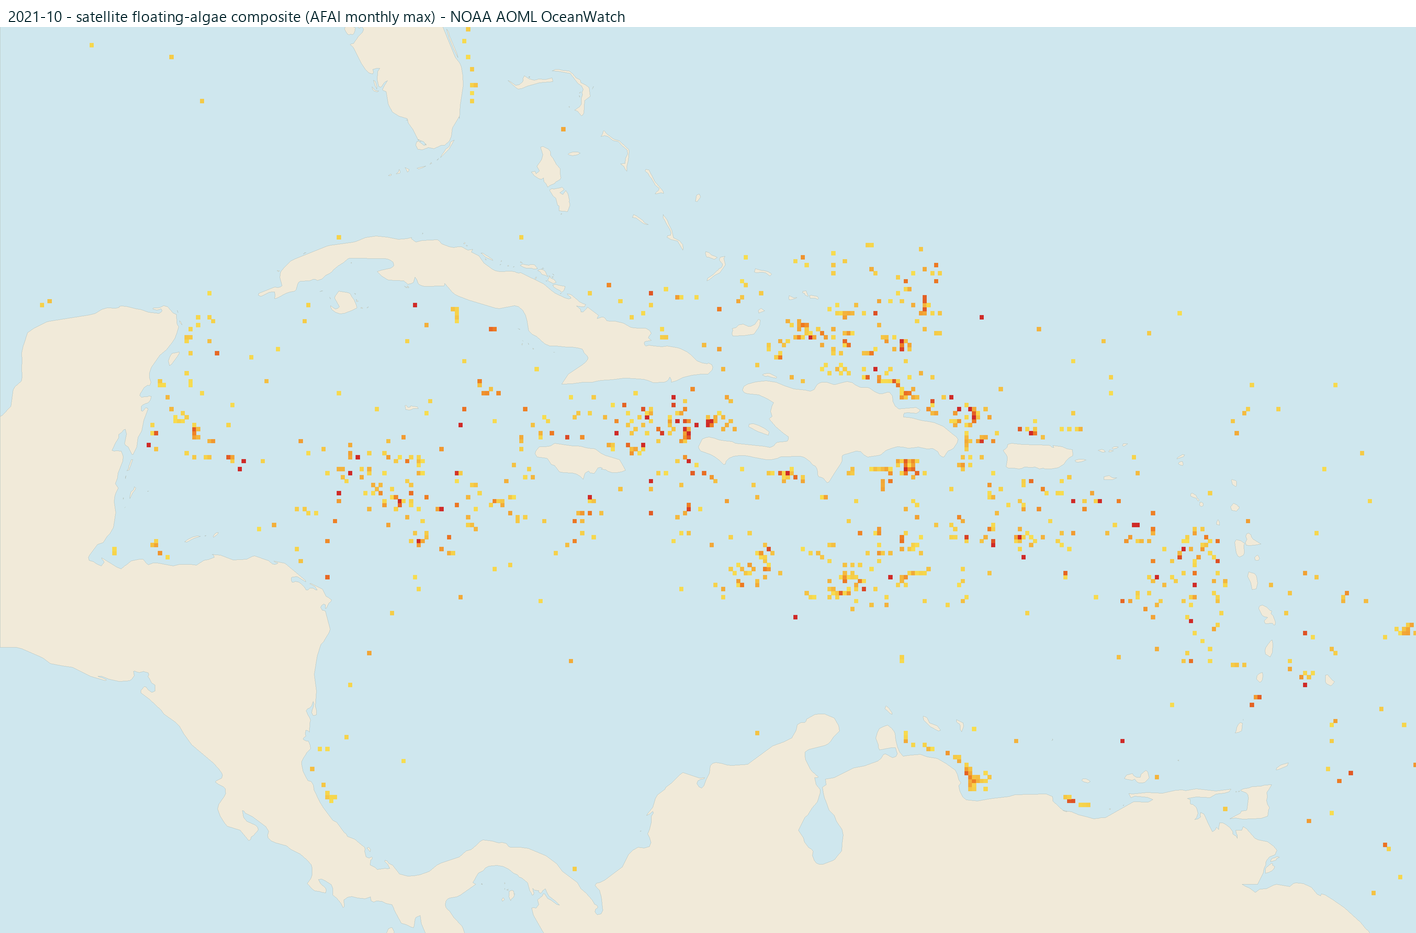
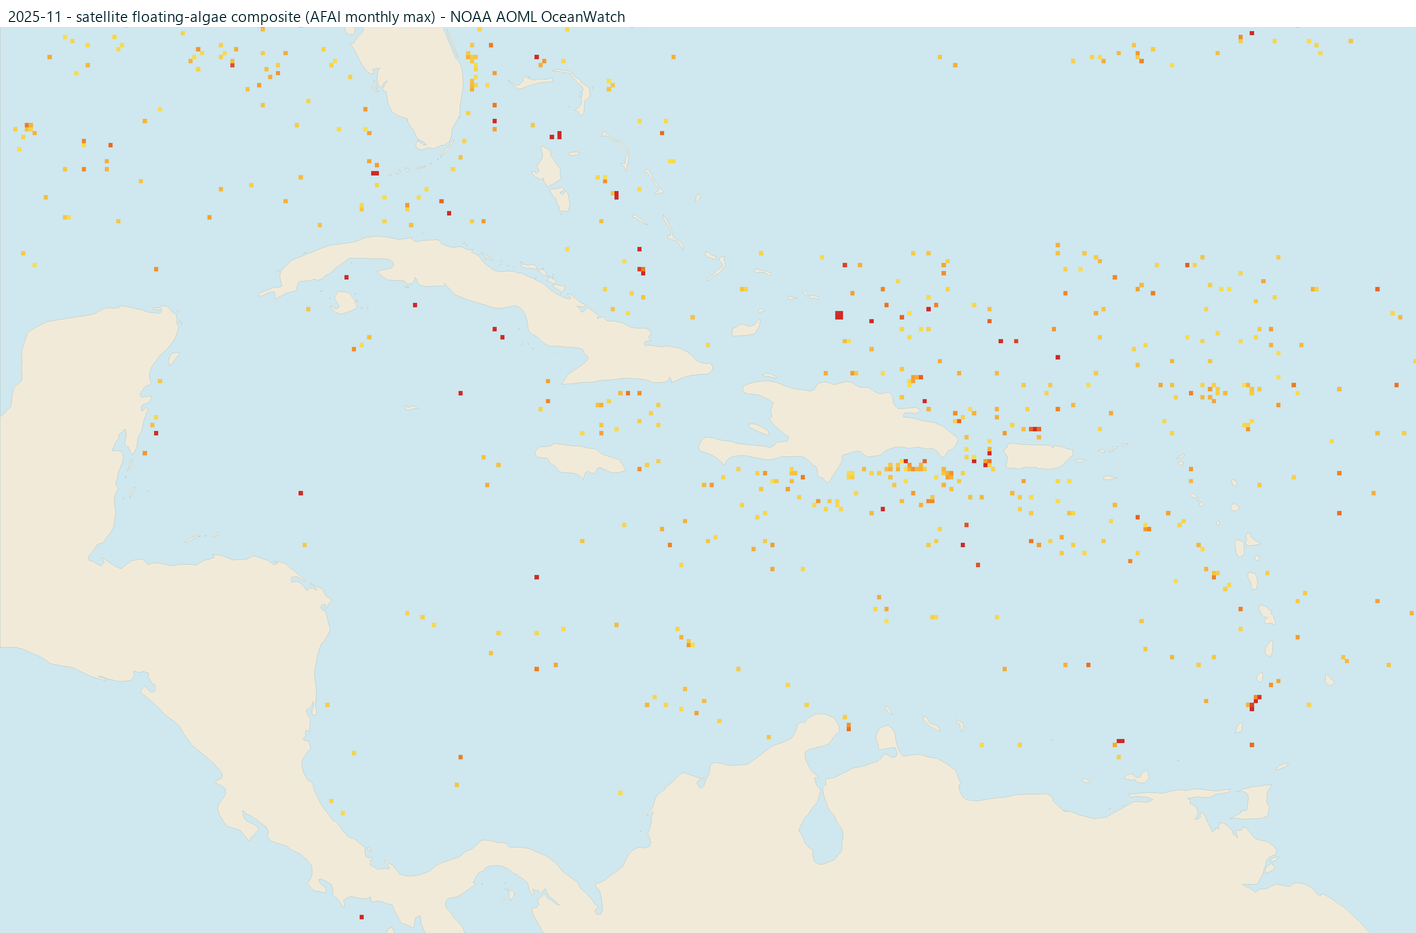
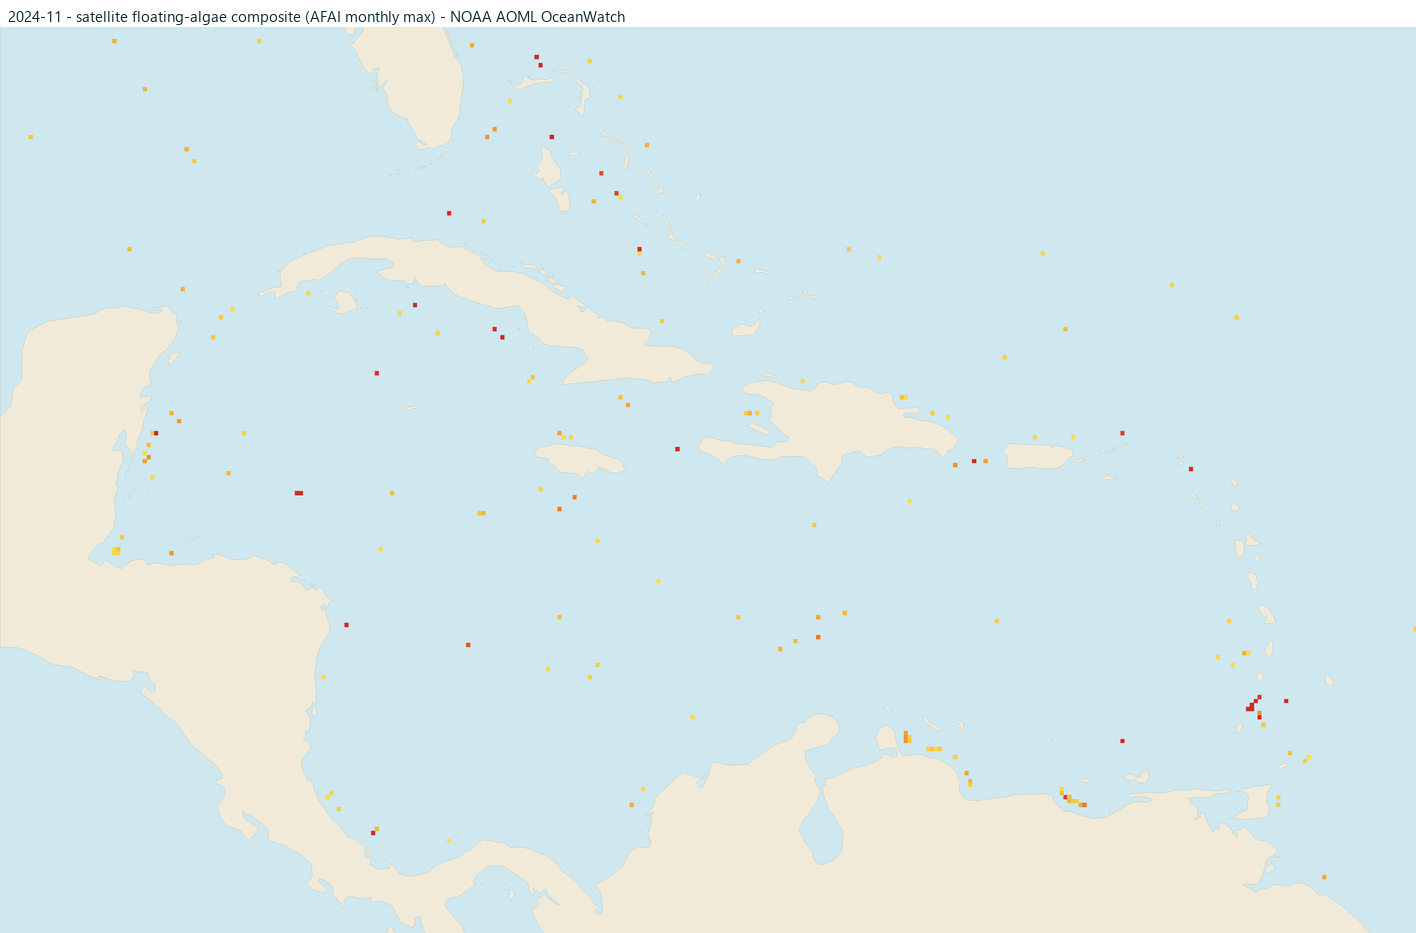
The current month is open; any month expands with a click. Any year can surprise, in either direction, so for what is happening now trust today's risk level and a camera over the calendar.
Often lower in the general Caribbean seasonal cycle.
Often lower, with the offshore season beginning to build.
The general Caribbean season is building.
The general Caribbean season is building.
Often within the higher part of the general season.
Often within the higher part of the general season.
Often within the higher part of the general season.
The broader summer season can remain active.
The general Caribbean season often begins easing.
The general Caribbean season often continues easing.
Often lower in the general Caribbean seasonal cycle.
This stretch of coast
The segment follows the Seven Mile Beach visitor zone. It is a destination view, not a report for every cove in western Jamaica.
The risk level above is measured along this specific coastline, not the whole country. Two beaches a short drive apart can have very different days; see how the atlas works for the details.
Questions travelers ask
Not necessarily. High means NOAA's satellites see elevated amounts of sargassum approaching this coast, so the odds of a bad beach day are up. Wind, currents, and hotel cleanup crews decide what actually lands on your stretch of sand. A camera or a same-day photo from your hotel settles it.
Because we would be guessing. We hold the level back when coverage is insufficient or the observation fails our freshness checks. After 48 hours, a rating only remains visible with an age note if a successful check within 36 hours confirmed it was NOAA's latest release. After 120 hours it is withheld in all cases. No data beats bad data when you are booking a trip.
Yes, genuinely. Shore angle, offshore barriers, currents, and cleanup effort vary hotel to hotel, which is why this atlas rates coastlines, not resorts. Recent guest photos and a direct question to the hotel are your best tools at that scale.